Deploy a Dockerized Application to Azure Kubernetes Service using Azure YAML Pipelines 6 – Telemetry and Diagnostics
This is the sixth post in a series where I'm taking a fresh look at how to deploy a dockerized application to Azure Kubernetes Service (AKS) using Azure Pipelines after having previously blogged about this in 2018. The list of posts in this series is as follows:
- Getting Started
- Terraform Development Experience
- Terraform Deployment Pipeline
- Running a Dockerized Application Locally
- Application Deployment Pipelines
- Telemetry and Diagnostics (this post)
One of the problems with running applications in containers in an orchestration system such as Kubernetes is that it can be harder to understand what is happening when things go wrong. So while instrumenting your application for telemetry and diagnostic information should be fairly high on your to do list anyway, this is even more so when running application is containers. Whilst there are lots of third party offerings in the telemetry and diagnostics space in this post I take a look at what's available for those wanting to stick with the Microsoft experience. If you want to follow along you can clone / fork my repo here, and if you haven't already done so please take a look at the first post to understand the background, what this series hopes to cover and the tools mentioned in this post.
Azure DevOps Environments
If you are following along with this series you may recall that in the last post we configured an Azure DevOps Pipeline Environment for the Kubernetes cluster. It turns out that these are great for quickly taking a peek at the health of the components deployed to a cluster. For example, this is what's displayed for the MegaStore.SaveSaleHandler deployment and pods:

It gets better though because you can drill in to the pods and view the log for each pod. This is the log from the message-queue-deployment pod:
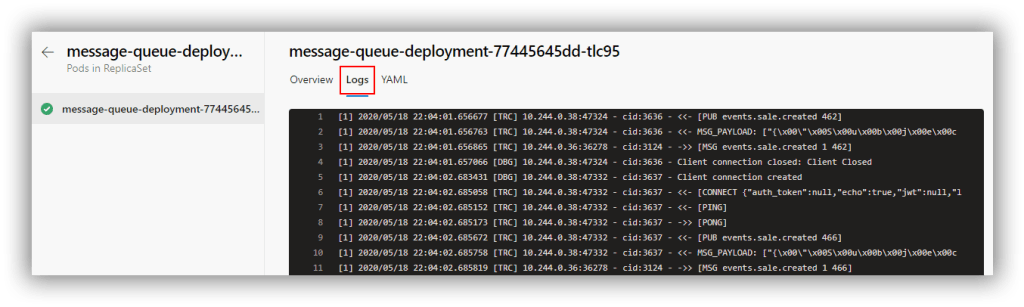
Of course, pipeline environments only really tell you what's going on at that moment in time (or maybe for the previous few minutes depending on how busy the logs are). In order to capture sufficient retrospective data to be useful requires the services of a dedicated tool.
Application Insights
From the docs: Application Insights, a feature of Azure Monitor, is an extensible Application Performance Management (APM) service for developers and DevOps professionals. When using it in conjunction with an application as we are here there are several configuration options to address. I describe an overview below, but everything is implemented in the sample application here.
Instrumentation keys
When using Application Insights with an application that is deployed to different environments it's important to take steps to ensure that telemetry from different environments is not mixed up together. The principal technique to avoid this is to have separate Application Insights resource instances which each have their own instrumentation key. Each stage of the deployment pipeline is then configured to make the appropriate instrumentation key available and the application running in that stage of the pipeline sends telemetry back using that key. The Terraform configuration developed in a previous post created three Application Insights resource instances for each of the environments the MegaStore application runs in:

When working with containers probably the easiest way to make an instrumentation key available to applications is via an environment variable named APPINSIGHTS_INSTRUMENTATIONKEY. An ASP.NET Core application component will automatically recognise APPINSIGHTS_INSTRUMENTATIONKEY—in other components it may need to be set manually. The MegaStore application contains a helper class (MegaStore.Helper.Env) to pass environment variables to calling code.
Server-Side Telemetry
Each component of an application that is required to generate server-side telemetry at the very least needs to consume one of the Application Insights SDKs as a NuGet. The MegaStore.Web ASP.NET Core component is configured with Microsoft.ApplicationInsights.AspNetCore and the MegaStore.SaveSaleHandler .NET Core console application component with Microsoft.ApplicationInsights.WorkerService.
These components are configured with the IServiceCollection class. For a .NET Core application the code is as follows:
|
|
IServiceCollection services = new ServiceCollection(); services.AddApplicationInsightsTelemetryWorkerService(Env.AppInsightsInstrumentationKey); // more config here IServiceProvider serviceProvider = services.BuildServiceProvider(); |
For an ASP.NET Core application the code is similar however IServiceCollection is supplied via the ConfigureServices method of the Startup class.
Client Side Telemetry
For web applications you may want to generate client-side usage telemetry and in ASP.NET Core applications this is achieved through two configuration steps:
- In _ViewImports.cshtml add @inject Microsoft.ApplicationInsights.AspNetCore.JavaScriptSnippet JavaScriptSnippet
- In _Layout.cshtml add @Html.Raw(JavaScriptSnippet.FullScript) at the end of the <head> section but before any other script.
You can read more about this here.
Kubernetes Enhancements
Since the deployed version of MegaStore runs under Kubernetes we can take advantage of the Microsoft.ApplicationInsights.Kubernetes NuGet package to enhance the standard Application Insights telemetry with Kubernetes-related information. With the NuGet installed you simply add the AddApplicationInsightsKubernetesEnricher(); extension method to IServiceCollection.
Visualising Application Components with Cloud Role
Application Insights uses an Application Map to visualise the components of a system. It will automatically name a component but it's a good idea to set this explicitly. This is achieved through the use of a CloudRoleTelemetryInitializer class, which you will need to add to each component that needs tracking:
|
|
using Microsoft.ApplicationInsights.Channel; using Microsoft.ApplicationInsights.Extensibility; namespace MegaStore.Web { public class CloudRoleTelemetryInitializer : ITelemetryInitializer { public void Initialize(ITelemetry telemetry) { telemetry.Context.Cloud.RoleName = "MegaStore.Web"; } } } |
The important part in the code above is in setting the RoleName. A CloudRoleTelemetryInitializer class is configured via IServiceCollection with this line of code:
|
|
services.AddSingleton<ITelemetryInitializer, CloudRoleTelemetryInitializer>(); |
Custom Telemetry
Adding your own custom telemetry is achieved with the TelemetryClient class. In an ASP.NET Core application TelemetryClient can be configured in a controller through dependency injection as described here. In a .NET Core Console app it's configured from IServiceProvider. The complete implementation in MegaStore.SaveSaleHandler is as follows:
|
|
// Class-level declaration private static TelemetryClient _telemetryClient; IServiceCollection services = new ServiceCollection(); services.AddApplicationInsightsTelemetryWorkerService(Env.AppInsightsInstrumentationKey); services.AddApplicationInsightsKubernetesEnricher(); services.AddSingleton<ITelemetryInitializer, CloudRoleTelemetryInitializer>(); IServiceProvider serviceProvider = services.BuildServiceProvider(); _telemetryClient = serviceProvider.GetRequiredService<TelemetryClient>(); |
There are then several options for generating telemetry including TelemetryClient.TrackEvent, TelemetryClient.TrackTrace and TelemetryClient.TrackException.
Generating Data
With all this configuration out of the way we can now start generating data. The first step is to find the IP addresses of the MegaStore.Web home pages for the qa and prd environments. One way is to bring up the Kubernetes Dashboard by running the following code: az aks browse --resource-group yourResourceGroup --name yourAksCluster.
Now switch to the desired namespace and navigate to Discovery and Load Balancing > Services to see the IP address of megastore-web-service:

My preferred way of generating traffic to these web pages is with a PowerShell snippet run from Azure Cloud Shell (which stops your own machine from being overloaded if you really crank things up by by reducing the Start-Sleep value):
|
|
while ($true) { (New-Object Net.WebClient).DownloadString("http://51.11.9.183/") Start-Sleep -Milliseconds 1000 } |
As tings stand you will probably mostly get ‘routine' telemetry being returned. If you want to simulate exceptions you can change the name of one of the columns in the database table dbo.Sale.
Visualising Data
Without any further configuration there are several areas of Application Insights that will now start displaying data. Here is just a small selection of what's available:
Overview Panel

Application Map Panel

Live Metrics Panel

Search Panel

Whilst all these overview representations of data are very useful it is in the detail where things perhaps get the most interesting. Drilling in to an individual Trace for example shows a useful set of standard Trace properties:

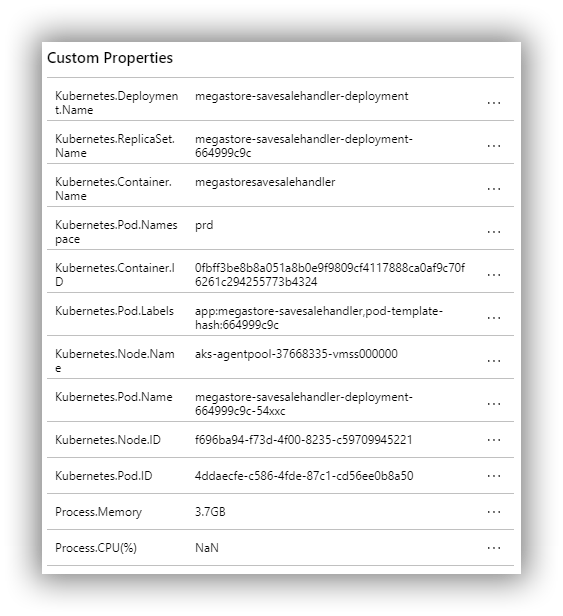
And also a set of custom Trace properties courtesy of Microsoft.ApplicationInsights.Kubernetes:
Drilling in to a synthetic exception (due to a changed column name in the database) provides details of the exception and also the stack trace:

These are just a few examples of what's available and a fuller list is available here. And this is just the application monitoring side of the whole Application Monitoring platform. A good starting point to see where Application Insights fits in to the bigger Azure Monitoring platform is the overview page here.
That's it folks!
That's it for this mini series! As I said in the first post, the ideas presented in this series are not meant to be the definitive, one and only, way of deploying a Dockerized ASP.NET Core application to Azure Kubernetes Service. Rather, they are intended to show my journey and hopefully give you ideas for doing things differently and better. To give you one example, I'm uneasy about having Kubernetes deployments described in static YAML files. Making modifications by hand somehow feels error prone and inefficient. There are other options though, and this post has a good explanation of the possibilities. From this post we see that there is a tool called Kustomize and then we see that there is an Azure DevOps Kubernetes manifest task that uses Kustomise. I've not explored this task yet but it looks like a good next step to understand how to evolve Kubernetes deployments.
If you have your own ideas for evolving the ideas in this series do leave a comment!
Cheers -- Graham
Deploy a Dockerized ASP.NET Core Application to Azure Kubernetes Service Using a VSTS CI/CD Pipeline: Part 4
In this blog post series I'm working my way through the process of deploying and running an ASP.NET Core application on Microsoft's hosted Kubernetes environment. These are the links to the full series of posts to date:
In this post I take a look at application monitoring and health. There are several options for this however since I'm pretty much all-in with the Microsoft stack in this blog series I'll stick with the Microsoft offering which is Azure Application Insights. This posts builds on previous posts, particularly Part 3, so please do consider working through at least Part 3 before this one.
In this post, I continue to use my MegaStore sample application which has been upgraded to .NET Core 2.1, in particular with reference to the csproj file. This is important because it affects the way Application Insights is configured in the ASP.NET Core web component. See here and here for more details. All my code is in my GitHub repo and you can find the starting code here and the finished code here.
Understanding the Application Insights Big Picture
Whilst it's very easy to get started with Application Insights, configuring it for an application with multiple components which gets deployed to a continuous delivery pipeline consisting of multiple environments running under Kubernetes requires a little planning and a little effort to get everything configured in a satisfactory way. As of the time of writing this isn't helped by the presence of Application Insights documentation on both docs.microsoft.com and github.com (ASP.NET Core | Kubernetes) which sometimes feels like it's conflicting, although it's nothing that good old fashioned detective work can't sort out.
The high-level requirements to get everything working are as follows:
- A mechanism is needed to separate out telemetry data from the different environments of the continuous delivery pipeline. Application Insights sends telemetry to a ‘bucket' termed an Application Insights Resource which is identified by a unique instrumentation key. Separation of telemetry data is therefore achieved by creating an individual Application Insights Resource, each for the development environment and the different environments of the delivery pipeline.
- Each component of the application that will send telemetry to an Application Insights Resource needs configuring so that it can be supplied with the instrumentation key for the Application Insights Resource for the environment the application is running in. This is a coding issue and there are lots of ways to solve it, however in the MegaStore sample application this is achieved through a helper class in the MegaStore.Helper library that receives the instrumentation key as an environment variable.
- The MegaStore.Web and MegaStore.SaveSaleHandler components need configuring for both the core and Kubernetes elements of Application Insights and a mechanism to send the telemetry back to Azure with the actual name of the component rather than a name that Application Insights has chosen.
- Each environment needs configuring to create an instrumentation key environment variable for the Application Insights Resource that has been created for that environment. In development this is achieved through hard-coding the instrumentation key in docker-compose.override.yaml. In the deployment pipeline it's achieved through a VSTS task that creates a Kubernetes config map that is picked up by the Kubernetes deployment configuration.
That's the big picture—let's get stuck in to the details.
Creating Application Insights Resources for Different Environments
In the Azure portal follow these slightly outdated instructions (Application Insights is currently found in Developer Tools) to create three Application Insights Resources for the three environments: DEV, DAT and PRD. I chose to put them in one resource group and ended up with this:

For reference there is a dedicated Separating telemetry from Development, Test, and Production page in the official Application Insights documentation set.
Configure MegaStore to Receive an Instrumentation Key from an Environment Variable
As explained above this is a specific implementation detail of the MegaStore sample application, which contains an Env class in MegaStore.Helper to capture environment variables. The amended class is as follows:
1 2 3 4 5 6 7 8 9 10 11 12 13 14 15 16 17 18 19 20 21 22 23 24 25 26 27 |
using System; using System.Collections.Generic; namespace MegaStore.Helper { // This code is modified from https://github.com/sixeyed/docker-on-windows public class Env { private static Dictionary<string, string> _Values = new Dictionary<string, string>(); public static string MessageQueueUrl { get { return Get("MESSAGE_QUEUE_URL"); } } public static string DbConnectionString { get { return Get("DB_CONNECTION_STRING"); } } public static string AppInsightsInstrumentationKey { get { return Get("APP_INSIGHTS_INSTRUMENTATION_KEY"); } } private static string Get(string variable) { if (!_Values.ContainsKey(variable)) { var value = Environment.GetEnvironmentVariable(variable); _Values[variable] = value; } return _Values[variable]; } } } |
Obviously this class relies on an external mechanism creating an environment variable named APP_INSIGHTS_INSTRUMENTATION_KEY. Consumers of this class can reference MegaStore.Helper and call Env.AppInsightsInstrumentationKey to return the key.
Configure MegaStore.Web for Application Insights
If you've upgraded an ASP.NET Core web application to 2.1 or later as detailed earlier then the core of Application Insights is already ‘installed' via the inclusion of the Microsoft.AspNetCore.All meta package so there is nothing to do. You will need to add Microsoft.ApplicationInsights.Kubernetes via NuGet—at the time of writing it was in beta (1.0.0-beta9) so you'll need to make sure you have told NuGet to include prereleases.
In order to enable Application Insights amend BuildWebHost in Program.cs as follows:
|
|
public static IWebHost BuildWebHost(string[] args) => WebHost.CreateDefaultBuilder(args) .UseStartup<Startup>() .UseApplicationInsights(Env.AppInsightsInstrumentationKey) .Build(); |
Note the way that the instrumentation key is passed in via Env.AppInsightsInstrumentationKey from MegaStore.Helper as mentioned above.
Telemetry relating to Kubernetes is enabled in ConfgureServices in Startup.cs as follows:
|
|
public void ConfigureServices(IServiceCollection services) { services.EnableKubernetes(); services.AddMvc(); services.AddSingleton<ITelemetryInitializer, CloudRoleTelemetryInitializer>(); } |
Note also that a CloudRoleTelemetryInitializer class is being initialised. This facilitates the setting of a custom RoleName for the component, and requires a class to be added as follows:
|
|
using Microsoft.ApplicationInsights.Channel; using Microsoft.ApplicationInsights.Extensibility; namespace MegaStore.Web { public class CloudRoleTelemetryInitializer : ITelemetryInitializer { public void Initialize(ITelemetry telemetry) { telemetry.Context.Cloud.RoleName = "MegaStore.Web"; } } } |
Note here that we are setting the RoleName to MegaStore.Web. Finally, we need to ensure that all web pages return telemetry. This is achieved by adding the following code to the end of _ViewImports.cshtml:
|
|
@inject Microsoft.ApplicationInsights.AspNetCore.JavaScriptSnippet JavaScriptSnippet |
and then by adding the following code to the end of the <head> element in _Layout.cshtml:
|
|
@Html.Raw(JavaScriptSnippet.FullScript) |
Configure MegaStore.SaveSaleHandler for Application Insights
I'll start this section with a warning because at the time of writing the latest versions of Microsoft.ApplicationInsights and Microsoft.ApplicationInsights.Kubernetes didn't play nicely together and resulted in dependency errors. Additionally the latest version of Microsoft.ApplicationInsights.Kubernetes was missing the KubernetesModule.EnableKubernetes class described in the documentation for making Kubernetes work with Application Insights. The Kubernetes bits are still in beta though so it's only fair to expect turbulence. The good news is that with a bit of experimentation I got everything working by installing NuGet packages Microsoft.ApplicationInsights (2.4.0) and Microsoft.ApplicationInsights.Kubernetes (1.0.0-beta3). If you try this long after publication date things will have moved on but this combination works with this initialisation code in Program.cs:
1 2 3 4 5 6 7 8 9 10 11 12 13 14 15 16 17 18 19 20 |
/* Requires these using statements: using Microsoft.ApplicationInsights; using Microsoft.ApplicationInsights.Extensibility; using Microsoft.ApplicationInsights.Kubernetes; */ class Program { private static TelemetryConfiguration configuration = new TelemetryConfiguration(Env.AppInsightsInstrumentationKey); static void Main(string[] args) { configuration.TelemetryInitializers.Add(new CloudRoleTelemetryInitializer()); KubernetesModule.EnableKubernetes(configuration); TelemetryClient client = new TelemetryClient(configuration); client.TrackTrace("Some message"); } } |
Please do note that this a completely stripped down Program class to just show how Application Insights and the Kubennetes extension is configured. Note again that this component uses the CloudRoleTelemetryInitializer class shown above, this time with the RoleName set to MegaStore.SaveSaleHandler. What I don't show here in any detail is that you can add lots of client.Track* calls to generate rich telemetry to help you understand what your application is doing. The code on my GitHub repo has details.
Configure the Development Environment to Create an Instrumentation Key Environment Variable
This is a simple matter of editing docker-compose.override.yaml with the new APP_INSIGHTS_INSTRUMENTATION_KEY environment variable and the instrumentation key for the corresponding Application Insights Resource:
1 2 3 4 5 6 7 8 9 10 11 12 13 14 15 16 17 18 19 20 21 22 23 24 25 26 27 28 29 30 31 32 33 34 |
version: '3.5' services: message-queue: image: nats:linux networks: - ms-net megastore.web: environment: - ASPNETCORE_ENVIRONMENT=Development - MESSAGE_QUEUE_URL=nats://message-queue:4222 - APP_INSIGHTS_INSTRUMENTATION_KEY=fba89ed9-z023-48f0-a7bb-6279ba6b5c87 ports: - 80 depends_on: - message-queue networks: - ms-net megastore.savesalehandler: environment: - MESSAGE_QUEUE_URL=nats://message-queue:4222 - APP_INSIGHTS_INSTRUMENTATION_KEY=fba89ed9-z023-48f0-a7bb-6279ba6b5c87 env_file: - db-credentials.env depends_on: - message-queue networks: - ms-net networks: ms-net: |
Make sure you don't just copy the code above as the actual key needs to come from the Application Insights Resource you created for the DEV environment, which you can find as follows:

Configure the VSTS Deployment Pipeline to Create Instrumentation Key Environment Variables
The first step is to amend the two Kubernetes deployment files (megastore-web-deployment.yaml and megastore-savesalehandler-deployment.yaml) with details of the new environment variable in the respective env sections:
|
|
- name: APP_INSIGHTS_INSTRUMENTATION_KEY valueFrom: configMapKeyRef: name: appinsights.env key: APP_INSIGHTS_INSTRUMENTATION_KEY |
Now in VSTS:
- Create variables called DatAppInsightsInstrumentationKey and PrdAppInsightsInstrumentationKey scoped to their respective environments and populate the variables with the respective instrumentation keys.
- In the task lists for the DAT and PRD environments clone the Delete ASPNETCORE_ENVIRONMENT config map and Create ASPNETCORE_ENVIRONMENT config map tasks and amend them to work with the new APP_INSIGHTS_INSTRUMENTATION_KEY environment variable configured in the *.deployment.yaml files.
Generate Traffic to the MegaStore Web Frontend
Now the real fun can begin! Commit all the code changes to trigger a build and deploy. The clumsy way I'm having to delete an environment variable and then recreate it (to cater for a changed variable name) will mean that the release will be amber in each environment for a couple of releases but will hopefully eventually go green. In order to generate some interesting telemetry we need to put one of the environments under load as follows:
- Find the public IP address of MegaStore.Web in the PRD environment by running kubectl get services --namespace=prd:

- Create a PowerShell (ps1) file with the following code (using your own IP address of course):
|
|
while ($true) { (New-Object Net.WebClient).DownloadString("http://23.97.208.183/") Start-Sleep -Milliseconds 5 } |
- Run the script (in Windows PowerShell ISE for example) and as long as the output is white you know that traffic is getting to the website.
Now head over to the Azure portal and navigate to the Application Insights Resource that was created for the PRD environment earlier and under Investigate click on Search and then Click here (to see all data in the last 24 hours):

You should see something like this:

Hurrah! We have telemetry! However the icing on the cake comes when you click on an individual entry (a trace for example) and see the Kubernetes details that are being returned with the basic trace properties:

Until Next Time
It's taken my quite a lot of research and experimentation to get to this point so that's it for now! In this post I showed you how to get started monitoring your Dockerized .NET Core 2.1 applications running in AKS using Application Insights. The emphasis has been very much on getting started though as Application Insights is a big beast and I've only scratched the surface in this post. Do bear in mind that some of the NuGets used in this post are in beta and some pain is to be expected.
As I publish this blog post VSTS has had a name change to Azure DevOps so that's the title of this series having to change again!
Cheers—Graham
Continuous Delivery with TFS / VSTS – Instrument for Telemetry with Application Insights
If you get to the stage where you are deploying your application on a very frequent basis and you are relying on automated tests for the bulk of your quality assurance then a mechanism to alert you when things go wrong in production is essential. There are many excellent tools that can help with this however anyone working working with ASP.NET websites (such as the one used in this blog series) and who has access to Azure can get going very quickly using Application Insights. I should qualify that by saying that whilst it is possible to get up-and-running very quickly with Application Insights there is a bit more work to do to make Application Insights a useful part of a continuous delivery pipeline. In this post in my blog series on Continuous Delivery with TFS / VSTS we take a look at doing just that!
The Big Picture
My aim in this post is to get telemetry from the Contoso University sample ASP.NET application running a) on my developer workstation, b) in the DAT environment and c) in the DQA environment. I'm not bothering with the PRD environment as it's essentially the same as DQA. (If you haven't been following along with this series please see this post for an explanation of the environments in my pipeline.) I also want to configure my web servers running IIS to send server telemetry to Azure.
Azure Portal Configuration
The starting point is some foundation work in Azure. We need to create three Application Insights resources inside three different resource groups representing the development workstation, the DAT environment and the DQA environment. A resource group for the development workstation doesn't exist so the first step is to create a new resource group called PRM-DEV. Then create three Application Insights resources in each of the resource groups -- I used the same names as the resource groups. For the DAT environment for example:

The final result should look something like this (note I added the resource group column in to the table):

Add the Application Insights SDK
With the Azure foundation work out of the way we can now turn our attention to adding the Application Insights SDK to the Contoso University ASP.NET application. (You can get the starting code from my GitHub repository here.) Application Insights is a NuGet package but it can be added by right-clicking the web project and choosing Add Application Insights Telemetry:

You are then presented with a configuration dialog which will allow you to select the correct Azure subscription and then the Application Insights resource -- in this case the one for the development environment:

You can then run Contoso University and see telemetry appear in both Visual Studio and the Azure portal. There is a wealth of information available so do explore the links to understand the extent.
Configure for Multiple Environments
As things stand we have essentially hard-coded Contoso University with an instrumentation key to send telemetry to just one Application Insights resource (PRM-DEV). Instrumentation keys are specific to one Application Insights resource so if we were to leave things as they are then a deployment of the application to the delivery pipeline would cause each environment to send its telemetry to the PRM-DEV Application Insights resource which would cause utter confusion. To fix this the following procedure can be used to amend an ASP.NET MVC application so that an instrumentation key can be passed in as a configuration variable as part of the deployment process:
- Add an iKey attribute to the appSettings section of Web.config (don't forget to use your own instrumentation key value from ApplicationInsights.config):
|
|
<appSettings> <!-- Other settings here --> <add key="iKey" value="8fc11978-dd5b-7b87-addc-965329534108"/> </appSettings> |
- Add a transform to Web.Release.config that consists of a token (__IKEY__) that can be used by Release Management:
|
|
<appSettings> <add key="iKey" value="__IKEY__" xdt:Transform="SetAttributes" xdt:Locator="Match(key)"/> </appSettings> |
- Add the following code to Application_Start in Global.asax.cs:
|
|
Microsoft.ApplicationInsights.Extensibility.TelemetryConfiguration.Active.InstrumentationKey = System.Web.Configuration.WebConfigurationManager.AppSettings["iKey"]; |
- As part of the Application Insights SDK installation Views.Shared._Layout.cshtml is altered with some JavaScript that adds the iKey to each page. This isn't dynamic and the JavaScript instrumentationKey line needs altering to make it dynamic as follows:
|
|
instrumentationKey: "@Microsoft.ApplicationInsights.Extensibility.TelemetryConfiguration.Active.InstrumentationKey" |
- Remove or comment out the InstrumentationKey section in ApplicationInsights.config.
As a final step run the application to ensure that Application Insights is still working. The code that accompanies this post can be downloaded from my GitHub account here.
Amend Release Management
As things stand a release build of Contoso University will have a tokenised appSettings key in Web.config as follows:
|
|
<add key="iKey" value="__IKEY__" /> |
When the build is deployed to the DAT and DQA environments the __IKEY__ token needs replacing with the instrumentation key for the respective resource group. This is achieved as follows:
- In the ContosoUniversity release definition click on the ellipsis of the DAT environment and choose Configure Variables. This will bring up a dialog to add an InstrumentationKey variable:

- The value for InstrumentationKey can be copied from the Azure portal. Navigate to Application Insights and then to the resource (PRM-DAT in the above screenshot) and then Configure > Properties where Instrumentation Key is to be found.
- The preceding process should be repeated for the DQA environment.
- Whilst still editing the release definition, edit the Website configuration tasks of both environments so that the Deployment > Scrip Arguments field takes a new parameter at the end called $(InstrumentationKey):

- In Visual Studio with the ContosoUniversity solution open, edit ContosoUniversity.Web.Deploy.Website.ps1 to accept the new InstrumentationKey as a parameter, add it to the $configurationData block and to use it in the ReplaceWebConfigTokens DSC configuration:
|
|
xTokenize ReplaceWebConfigTokens { Recurse = $false Tokens = @{DATA_SOURCE = $Node.SqlServerName; INITIAL_CATALOG = "ContosoUniversity"; IKEY = $Node.InstrumentationKey} UseTokenFiles = $false Path = "C:\temp\website" SearchPattern = "web.config" } |
- Check in the code changes so that a build and release are triggered and then check that the Application Insights resources in the Azure portal are displaying telemetry.
Install Release Annotations
A handy feature that became available in early 2016 was the ability to add Release Annotations, which is a way to identify releases in the Application Insights Metrics Explorer. Getting this set up is as follows:
- Release Annotations is an extension for VSTS or TFS 2015.2 and later and needs to be installed from the marketplace via this page. I installed it for my VSTS account.
- In the release definition, for each environment (I'm just showing the DAT environment below) add two variables -- ApplicationId and ApiKey but leave the window open for editing:

- In a separate browser window, navigate to the Application Insights resource for that environment in the Azure portal and then to the API Access section.
- Click on Create API key and complete the details as follows:

- Clicking Generate key will do just that:

- You should now copy the Application ID value hand API key value (both highlighted in the screenshot above) to the respective text boxes in the browser window where the release definition environment variables window should still be open. After marking the ApiKey as a secret with the padlock icon this window can now be closed.
- The final step is to add a Release Annotation task to the release definition:

- The Release Annotation is then edited with the ApplicationId and ApiKey variables:

- The net result of this can be seen in the Application Insights Metrics Explorer following a successful release where the release is displayed as a blue information icon:

- Clicking the icon opens the Release Properties window which displays rich details about the release.
Install the Application Insights Status Monitor
Since we are running our web application under IIS even more telemetry can be gleaned by installing the Application Insights Status Monitor:
- On the web servers running IIS download and install Status Monitor.
- Sign in to your Azure account in the configuration dialog.
- Use Configure settings to choose the correct Application Insights resource.
- Add the domain account the website is running under (via the application pool) to the Performance Monitor Users local security group.
The Status Monitor window should finish looking something like this:

See this documentation page to learn about the extra telemetry that will appear.
Wrapping Up
In this post I've only really covered configuring the basic components of Application Insights. In reality there's a wealth of other items to configure and the list is bound to grow. Here's a quick list I've come up with to give you a flavour:
This list however doesn't include the huge number of options for configuring Application Insights itself. There's enough to keep anyone interested in this sort of thing busy for weeks. The documentation is a great starting point -- check out the sidebar here.
Cheers -- Graham
Continuous Delivery with TFS: Configure Application Insights
If you get to the stage where you are deploying your application on a very frequent basis and you are relying on automated tests for the bulk of your quality assurance then a mechanism to alert you when things go wrong becomes crucial. You should have something in place anyway of course but in practice I suspect that application monitoring is either frequently overlooked or remains stubbornly on the to-do list.
A successful continuous delivery pipeline implementation shouldn't rely on the telephone or email as the alerting system and in this post in my blog series on implementing continuous delivery with TFS we look at how to integrate relevant parts of Microsoft's Application Insights (AI) tooling in to the pipeline. If you need to get up to speed with its capabilities I have a Getting Started blog post here. As a quick refresher AI is a suite of components that integrate with your application and servers and which sends telemetry to the Azure Portal. As a bonus, not only do you get details of diagnostic issues but also rich analytics on how you application is being used.
Big Picture
AI isn't just one component and in fact there are at least three main ways in which AI can be configured to provide diagnostic and analytic information:
- Adding the Application Insights SDK to your application.
- Installing Status Monitor on an IIS server.
- Creating Web Tests that monitor the availability of an HTTP endpoint available on the public Internet.
One key point to appreciate with AI and continuous delivery pipelines is that unless you do something about it AI will put the data it collects from the different stages of your pipeline in one ‘bucket' and you won't easily be able to differentiate what came from where. Happily there is a way to address this as we'll see below. Before starting to configure AI there are some common preparatory steps that need to be addressed so let's start with those.
Groundwork
If you have been following along with this series of blog posts you will be aware that so far we have only created DAT and DQA stages of the pipeline. Although not strictly necessary I created a PRD stage of the pipeline to represent production: if nothing else it's handy for demonstrations where your audience may expect to see the pipeline endpoint. I won't detail all the configuration steps here as they are all covered by previous blog posts however the whole exercise only took a few minutes. As things stand none of these stages exposes our sample web application to the public Internet however this is necessary for the creation of Web Tests. We can fix this in the Azure portal by adding an HTTP endpoint to the VM that runs IIS:

Our sample application is now available using a URL that begins with the cloud service name and includes the website name, for example http://mycloudservice.cloudapp.net/mywebapp. Be aware that this technique probably falls foul of all manner of security best practices however given that my VMs are only on for a few hours each week and it's a pure demo environment it's one I'm happy to live with.
The second item of groundwork is to create the containers that will hold the AI data for each stage of the pipeline. You will need to use the new Azure portal for this at https://portal.azure.com. First of all a disclaimer. There are several techniques at our disposal for segregating AI data as discussed in this blog post by Victor Mushkatin, and the comments of this post are worth reading as well since there are some strong opinions. I tried the tagging method but couldn't get it to work properly and as Victor says in the post this feature is at the early stages of development. In his post Victor creates a new Azure Resource for each pipeline stage however that seemed overly complicated for a demo environment. Instead I opted to create multiple Application Insights Resources in one Azure Resource group. As an aside, resource groups are fairly new to Azure and for any new Azure deployment they should be carefully considered as part of the planning process. For existing deployments you will find that your cloud service is listed as a resource group (containing your VMs) and I chose to use this as the group to contain the Application Insights Resources. Creating new AI resources is very straightforward. Start with the New button and then choose Developer Services > Application Insights. You'll need to provide a name and then use the arrow selectors to choose Application Type and Resource Group:

I created the following resource groups which represent the stages of my pipeline: CU-DEV, CU-DAT, CU-DQA and CU-PRD. What differentiates these groups is their instrumentation keys (often abbreviated to ikey). You'll need to retrieve the ikeys for each group and the way to do that in the new portal is via Browse > Filter By > Application Insights > $ResourceGroup$ > Settings > Properties where you will see the Instrumentation Key selector.
Add the Application Insights SDK to ContosoUniversity
We can now turn our attention to adding the Application Insights SDK to our Contoso University web application:
- Right-click your web project (ContosoUniversity.Web) within your Visual Studio solution and choose Add Application Insights Telemetry.

- The Add Application Insights to Project dialog opens and invites you to sign in to Azure:

- The first few times I tried to connect to Azure I got errors about not being able to find an endpoint but persistence paid off. I eventually arrived at a dialog that allowed me to choose my MSDN subscription via the Use different account link:

- Having already created my AI resources I used Configure settings to choose the CU-DEV resource:

- Back in the Add Application Insights to Project dialog click on the Add Application Insights to Project link to have Visual Studio perform all the necessary configuration.
At this stage we can run the application and click around to generate telemetry. If you are in Debug mode you can see this in the Output window. After a minute or two you should also see the telemetry start to appear in the Azure portal (Browse > Filter By > Application Insights > CU-DEV).
Configure AI in Contoso University for Pipeline Stages
As things stand deploying Contoso University to other stages of the pipeline will cause telemetry for that stage to be added to the CU-DEV AI resource group. To remedy this carry out the following steps:
- Add an iKey attribute to the appSettings section of Web.config:
|
|
<appSettings> <!-- Other settings here --> <add key="iKey" value="8fc11978-dd5b-7b87-addc-965329534108"/> </appSettings> |
- Add a transform to Web.Release.config that consists of a token (__IKEY__) that can be used by Release Management:
|
|
<appSettings> <add key="iKey" value="__IKEY__" xdt:Transform="SetAttributes" xdt:Locator="Match(key)"/> </appSettings> |
- Add the following code to Application_Start in Global.asax.cs:
|
|
Microsoft.ApplicationInsights.Extensibility.TelemetryConfiguration.Active.InstrumentationKey = System.Web.Configuration.WebConfigurationManager.AppSettings["iKey"]; |
- As part of the AI installation Views.Shared._Layout.cshtml is altered with some JavaScript that adds the iKey to each page. This isn't dynamic and the JavaScript instrumentationKey line needs altering to make it dynamic as follows:
|
|
instrumentationKey: "@Microsoft.ApplicationInsights.Extensibility.TelemetryConfiguration.Active.InstrumentationKey" |
- Remove or comment out the InstrumentationKey section in ApplicationInsights.config.
- In the Release Management client at Configure Apps > Components edit the ContosoUniversity\Deploy Web Site component by adding an IKEY variable to Configuration Variables.
- Still in the Release Management client open the Contoso University\DAT>DQA>PRD release template from Configure Apps > Agent-based Release Templates and edit each stage supplying the iKey value for that stage (see above for how to get this) to the newly added IKEY configuration variable.
After completing these steps you should be able to deploy your application to each stage of the pipeline and see that the Web.config of each stage has the correct iKey. Spinning up the website for that stage and clicking around in it should cause telemetry to be sent to the respective AI resource.
Install Status Monitor on the IIS server
The procedure is quite straightforward as follows:
- On your IIS server (ALMWEB01 if you are following the blog series) download and run the Status Monitor installation package from here.
- With the installation complete you'll need to sign in to your Microsoft Account after which you'll be presented with a configuration panel where the CU-DAT, CU-DQA and CU-PRD websites should have been discovered. The control panel lets you specify a separate AI resource for each website after which you'll need to restart IIS:

- In order to ensure that the domain accounts that the websites are running under have sufficient permissions to collect data make sure that they have been added to the Performance Monitor Users Windows local group.
With this configuration complete you should click around in the websites to confirm that telemetry is being sent to the Azure portal.
Creating Web Tests to monitor HTTP Availability
The configuration for Web Tests takes place in the new Azure portal at https://portal.azure.com. There are two types of test -- URL ping and a more involved Multi-step test. I'm just describing the former here as follows:
- In the new portal navigate to the AI resource you want to create tests for and choose the Availability tile:

- This opens the Web Tests pane where you choose Add web test:

- In the Create test pane supply a name and a URL and then use the arrow on Test Locations to choose locations to test from:

After clicking Create you should start to see data being generated within a few seconds.
In Conclusion
AI is clearly a very sophisticated solution for providing rich telemetry about your application and the web server hosting and I'm exited about the possibilities it offers. I did encounter a few hurdles in getting it to work though. Initial connection to the Azure portal when trying to integrate the SDK with Contoso University was the first problem and this caused quite a bit of messing around as each failed installation had to be undone. I then found that with AI added to Contoso University the build on my TFS server failed every time. I'm using automatic package restore and I could clearly see what's happening: every AI NuGet package was being restored correctly with the exception of Microsoft.ApplicationInsights and this was quite rightly causing the build to fail. Locally on my development machine the package restore worked flawlessly. The answer turned out to be an outdated nuget.exe on my build server. The fix is to open an Administrative command prompt at C:\Program Files\Microsoft Team Foundation Server 12.0\Tools and run nuget.exe update -self. Instant fix! This isn't AI's fault of course, although it is a mystery why one of the AI NuGets brought this problem to light.
Cheers -- Graham
Getting Started with Application Insights
If the latest release of your application has a problem chances are you would prefer to know before your users flood your inbox or start complaining on social media channels. Additionally it is probably a good idea to monitor what your users get up to in your application to help you prioritise future development activities. And so to the world of diagnostics and analytics software. There are offerings from several vendors to consider in this area but as good a place to start as any is Microsoft's Application Insights. Here is a list of resources to help you understand what is can do for you:
At the time of writing this post Application Insights is in public preview -- see here for details. Do bear in mind that it's a chargeable service with full pricing due to take effect in June 2015.
Cheers -- Graham


