Continuous Delivery with TFS: Configuration Tweaks to Help Bake Quality In
In the previous post in my series on implementing continuous delivery with TFS we got to the point of being able to deploy our sample application to each stage of the delivery pipeline. That's a great point to get to because we've now automated our deployment process and have a mechanism (which isn't perfect since it's not version controlled) for managing configuration. However there is a lot more we can and should do to help ensure that our software and ALM processes have quality baked in from the outset rather than added as an afterthought.
Configure Code Analysis
A simple first step is to configure Code Analysis for the ContosoUniversity.Web project. (We've already done this for ContosoUniversity.Database.) From the properties page of ContosoUniversity.Web navigate to the Code Analysis tab and change the Configuration to All Configurations. and check Enable Code Analysis on Build. By default the rule set that is selected is Microsoft Managed Recommended Rules but this doesn't generate any code analysis issues -- at least on my project. That doesn't help illustrate the benefit so change the rule set to Microsoft All Rules. Save the setting and perform a build (ie F6) and the Code Analysis tool window should present us with a nice list of ‘issues'.
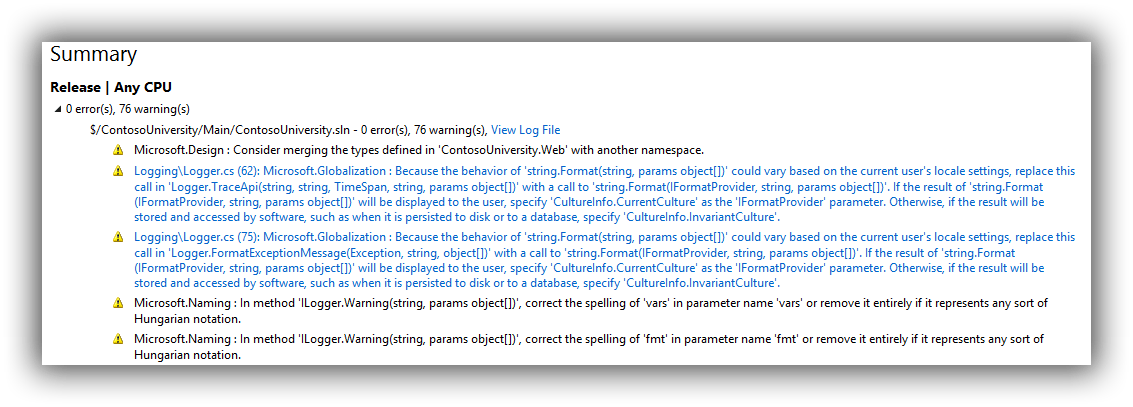
Check the change in to version control and then edit the ContosoUniversity_Main_Checkin build definition setting Process > Build process parameters > 2. Build 5. Advanced > Perform code analysis = Always (belt and braces since the AsConfigured setting ought to work but this ensures it will if anyone meddles with the project settings). Save ContosoUniversity_Main_Checkin and queue a new build. The build report should now show the issues as warnings (abridged version in screenshot):
To keep everything synchronised perform the same change to ContosoUniversity_Main_Nightly and check that it too generates the same warnings. The combination of running code analysis when the solution builds both locally and during continuous integration should give developers enough of a clue that they should be attending to these warnings. To be fair, just setting projects up to use Microsoft All Rules and forcing them all to be fixed isn't a likely recipe for success. Some rules might not apply or might not be appropriate. And if the development team are working on an inherited brownfield application all bets are off! If a more Draconian approach is genuinely needed there is another trick up TFS's sleeve which I mention later in this post. For now you may want to switch back to Microsoft Managed Recommended Rules to keep the noise down.
Configure Unit Test Results
Unit testing is hopefully by now an ingrained aspect of your team's software development practices. But how do you keep track of progress? This is pretty easy to do as part of the TFS build and our starting point is to add a Unit Test Project.
I'm calling mine ContosoUniversity.Web.UnitTests to differentiate from the automated web tests that we'll be adding in a later post but the takehome message here is that you should have a naming convention that works for your scenario as these test projects can quickly get your solution in to a mess if you are not pro-active about managing them. With that out of the way I want to be quite clear that this post isn't going to be a lesson in how to write unit tests and I'm simply going to do some daft things with Assert to quickly illustrate what can be achieved as part of the TFS build process. With that in mind amend the UnitTest1 class so you have two test methods with simple Assert statements:
|
1 2 3 4 5 6 7 8 9 10 11 |
[TestMethod] public void TestMethod1() { Assert.AreEqual(1, 1); } [TestMethod] public void TestMethod2() { Assert.AreEqual(1, 1); } |
Run the tests from Test Explorer and we should now have two passing tests. Check everything in to version control and queue a new build from ContosoUniversity_Main_Checkin. Examining the build report you should see that a test run was completed with 100% pass rate.
Now change one of the tests so that it will fail (Assert.AreEqual(1, 0);), check the change in to version control and queue another build from ContosoUniversity_Main_Checkin. The build report should now show that the build only partially succeeded:
Additionally the Summary section now advises on the specifics of how many tests passed:
We haven't had to do anything to get this information about our unit tests and that's because out of the box the build template comes configured to run any tests that are in projects conforming to a **\*test*.dll;**\*test*.appx file specification. All this can be configured from a build definition under Process > Build process parameters > 3. Test > 1. Automated tests. Hours of fun can be had tweaking all this but there are two other options which may be of interest which you can access by clicking on the ellipsis of the 1. Test source row. This brings up the Add/Edit Test Run dialog where it's possible to set Fail build on test failure and Enable Code Coverage from the Options dropdown:
To see the effect of these settings make the changes and save out of the build definition editing process. Queue a new build which should now fail. You should also see that we now have code coverage results:
To be very clear this isn't the end of this story because code coverage is reporting on our unit test project which isn't what we want. To exclude the unit test project itself we need to add a .runsettings file to the solution. That's out of scope in this post but you can find more details here if you want to try it out. If you want even more details about the state your code is in you should look at something like SonarQube.
Source Control Settings
A final area that we'll look at in this post are the settings that can be accessed via Team Explorer > Settings > Team Project > Source Control. This brings up the Source Control Settings dialog where Check-in Policy > Add is of particular interest.
This allows the following to be configured (descriptions shamelessly copied from the Description label):
- Builds -- This policy requires that the last build was successful for each affected continuous integration build definition.
- Changeset Comments Policy -- This policy will require users to provide check-in comments.
- Code Analysis -- This policy requires that Code Analysis is run before check-in.
- Custom Path Policy -- This policy scopes other policies to specific folders or file types.
- Forbidden Patterns Policy -- This policy prevents users from checking in files with forbidden filename patterns.
- Work Item Query Policy -- This policy allows you to specify a work item query whose results will be the only legal work items for a check-in to be associated with.
- Work Items -- This policy requires that one or more work items be associated with every check-in.
I'm not going to explain these further than their descriptions as they are pretty self-explanatory, suffice to say that there's a lot one can do here to ensure a robust check-in process. A word of caution though: most of these policies can be overridden so use them wisely or your developers will start to do just that.
That's it for this post. Next up is the thrilling world of developing automated web tests with Selenium.
Cheers -- Graham


