Deploy a Dockerized Application to Azure Kubernetes Service using Azure YAML Pipelines 6 – Telemetry and Diagnostics
This is the sixth post in a series where I'm taking a fresh look at how to deploy a dockerized application to Azure Kubernetes Service (AKS) using Azure Pipelines after having previously blogged about this in 2018. The list of posts in this series is as follows:
- Getting Started
- Terraform Development Experience
- Terraform Deployment Pipeline
- Running a Dockerized Application Locally
- Application Deployment Pipelines
- Telemetry and Diagnostics (this post)
One of the problems with running applications in containers in an orchestration system such as Kubernetes is that it can be harder to understand what is happening when things go wrong. So while instrumenting your application for telemetry and diagnostic information should be fairly high on your to do list anyway, this is even more so when running application is containers. Whilst there are lots of third party offerings in the telemetry and diagnostics space in this post I take a look at what's available for those wanting to stick with the Microsoft experience. If you want to follow along you can clone / fork my repo here, and if you haven't already done so please take a look at the first post to understand the background, what this series hopes to cover and the tools mentioned in this post.
Azure DevOps Environments
If you are following along with this series you may recall that in the last post we configured an Azure DevOps Pipeline Environment for the Kubernetes cluster. It turns out that these are great for quickly taking a peek at the health of the components deployed to a cluster. For example, this is what's displayed for the MegaStore.SaveSaleHandler deployment and pods:

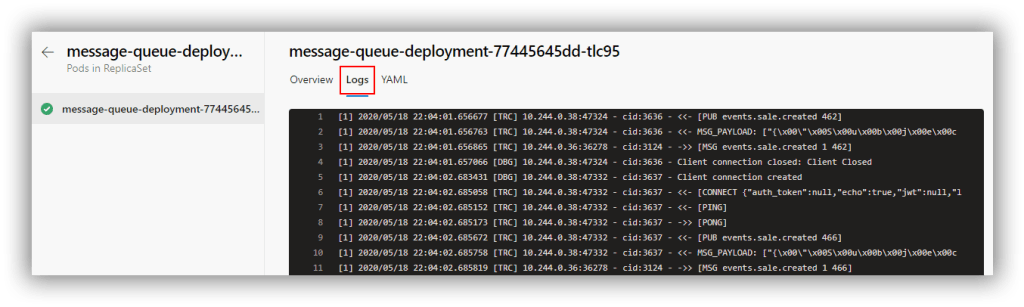
It gets better though because you can drill in to the pods and view the log for each pod. This is the log from the message-queue-deployment pod:
Of course, pipeline environments only really tell you what's going on at that moment in time (or maybe for the previous few minutes depending on how busy the logs are). In order to capture sufficient retrospective data to be useful requires the services of a dedicated tool.
Application Insights
From the docs: Application Insights, a feature of Azure Monitor, is an extensible Application Performance Management (APM) service for developers and DevOps professionals. When using it in conjunction with an application as we are here there are several configuration options to address. I describe an overview below, but everything is implemented in the sample application here.
Instrumentation keys
When using Application Insights with an application that is deployed to different environments it's important to take steps to ensure that telemetry from different environments is not mixed up together. The principal technique to avoid this is to have separate Application Insights resource instances which each have their own instrumentation key. Each stage of the deployment pipeline is then configured to make the appropriate instrumentation key available and the application running in that stage of the pipeline sends telemetry back using that key. The Terraform configuration developed in a previous post created three Application Insights resource instances for each of the environments the MegaStore application runs in:

When working with containers probably the easiest way to make an instrumentation key available to applications is via an environment variable named APPINSIGHTS_INSTRUMENTATIONKEY. An ASP.NET Core application component will automatically recognise APPINSIGHTS_INSTRUMENTATIONKEY—in other components it may need to be set manually. The MegaStore application contains a helper class (MegaStore.Helper.Env) to pass environment variables to calling code.
Server-Side Telemetry
Each component of an application that is required to generate server-side telemetry at the very least needs to consume one of the Application Insights SDKs as a NuGet. The MegaStore.Web ASP.NET Core component is configured with Microsoft.ApplicationInsights.AspNetCore and the MegaStore.SaveSaleHandler .NET Core console application component with Microsoft.ApplicationInsights.WorkerService.
These components are configured with the IServiceCollection class. For a .NET Core application the code is as follows:
|
|
IServiceCollection services = new ServiceCollection(); services.AddApplicationInsightsTelemetryWorkerService(Env.AppInsightsInstrumentationKey); // more config here IServiceProvider serviceProvider = services.BuildServiceProvider(); |
For an ASP.NET Core application the code is similar however IServiceCollection is supplied via the ConfigureServices method of the Startup class.
Client Side Telemetry
For web applications you may want to generate client-side usage telemetry and in ASP.NET Core applications this is achieved through two configuration steps:
- In _ViewImports.cshtml add @inject Microsoft.ApplicationInsights.AspNetCore.JavaScriptSnippet JavaScriptSnippet
- In _Layout.cshtml add @Html.Raw(JavaScriptSnippet.FullScript) at the end of the <head> section but before any other script.
You can read more about this here.
Kubernetes Enhancements
Since the deployed version of MegaStore runs under Kubernetes we can take advantage of the Microsoft.ApplicationInsights.Kubernetes NuGet package to enhance the standard Application Insights telemetry with Kubernetes-related information. With the NuGet installed you simply add the AddApplicationInsightsKubernetesEnricher(); extension method to IServiceCollection.
Visualising Application Components with Cloud Role
Application Insights uses an Application Map to visualise the components of a system. It will automatically name a component but it's a good idea to set this explicitly. This is achieved through the use of a CloudRoleTelemetryInitializer class, which you will need to add to each component that needs tracking:
|
|
using Microsoft.ApplicationInsights.Channel; using Microsoft.ApplicationInsights.Extensibility; namespace MegaStore.Web { public class CloudRoleTelemetryInitializer : ITelemetryInitializer { public void Initialize(ITelemetry telemetry) { telemetry.Context.Cloud.RoleName = "MegaStore.Web"; } } } |
The important part in the code above is in setting the RoleName. A CloudRoleTelemetryInitializer class is configured via IServiceCollection with this line of code:
|
|
services.AddSingleton<ITelemetryInitializer, CloudRoleTelemetryInitializer>(); |
Custom Telemetry
Adding your own custom telemetry is achieved with the TelemetryClient class. In an ASP.NET Core application TelemetryClient can be configured in a controller through dependency injection as described here. In a .NET Core Console app it's configured from IServiceProvider. The complete implementation in MegaStore.SaveSaleHandler is as follows:
|
|
// Class-level declaration private static TelemetryClient _telemetryClient; IServiceCollection services = new ServiceCollection(); services.AddApplicationInsightsTelemetryWorkerService(Env.AppInsightsInstrumentationKey); services.AddApplicationInsightsKubernetesEnricher(); services.AddSingleton<ITelemetryInitializer, CloudRoleTelemetryInitializer>(); IServiceProvider serviceProvider = services.BuildServiceProvider(); _telemetryClient = serviceProvider.GetRequiredService<TelemetryClient>(); |
There are then several options for generating telemetry including TelemetryClient.TrackEvent, TelemetryClient.TrackTrace and TelemetryClient.TrackException.
Generating Data
With all this configuration out of the way we can now start generating data. The first step is to find the IP addresses of the MegaStore.Web home pages for the qa and prd environments. One way is to bring up the Kubernetes Dashboard by running the following code: az aks browse --resource-group yourResourceGroup --name yourAksCluster.
Now switch to the desired namespace and navigate to Discovery and Load Balancing > Services to see the IP address of megastore-web-service:

My preferred way of generating traffic to these web pages is with a PowerShell snippet run from Azure Cloud Shell (which stops your own machine from being overloaded if you really crank things up by by reducing the Start-Sleep value):
|
|
while ($true) { (New-Object Net.WebClient).DownloadString("http://51.11.9.183/") Start-Sleep -Milliseconds 1000 } |
As tings stand you will probably mostly get ‘routine' telemetry being returned. If you want to simulate exceptions you can change the name of one of the columns in the database table dbo.Sale.
Visualising Data
Without any further configuration there are several areas of Application Insights that will now start displaying data. Here is just a small selection of what's available:
Overview Panel

Application Map Panel

Live Metrics Panel

Search Panel

Whilst all these overview representations of data are very useful it is in the detail where things perhaps get the most interesting. Drilling in to an individual Trace for example shows a useful set of standard Trace properties:

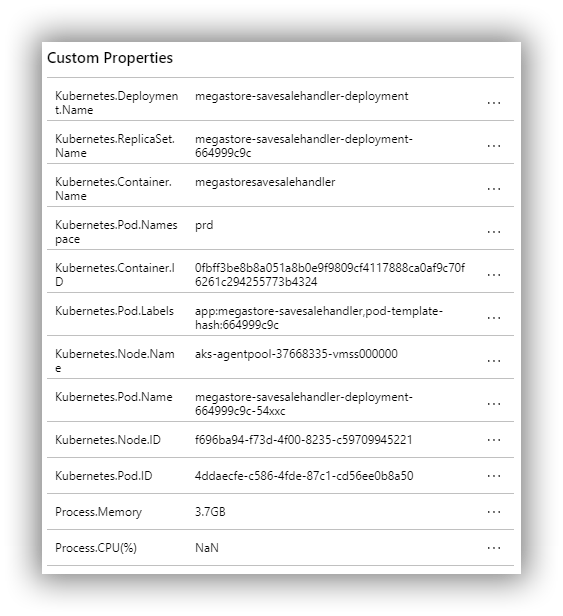
And also a set of custom Trace properties courtesy of Microsoft.ApplicationInsights.Kubernetes:
Drilling in to a synthetic exception (due to a changed column name in the database) provides details of the exception and also the stack trace:

These are just a few examples of what's available and a fuller list is available here. And this is just the application monitoring side of the whole Application Monitoring platform. A good starting point to see where Application Insights fits in to the bigger Azure Monitoring platform is the overview page here.
That's it folks!
That's it for this mini series! As I said in the first post, the ideas presented in this series are not meant to be the definitive, one and only, way of deploying a Dockerized ASP.NET Core application to Azure Kubernetes Service. Rather, they are intended to show my journey and hopefully give you ideas for doing things differently and better. To give you one example, I'm uneasy about having Kubernetes deployments described in static YAML files. Making modifications by hand somehow feels error prone and inefficient. There are other options though, and this post has a good explanation of the possibilities. From this post we see that there is a tool called Kustomize and then we see that there is an Azure DevOps Kubernetes manifest task that uses Kustomise. I've not explored this task yet but it looks like a good next step to understand how to evolve Kubernetes deployments.
If you have your own ideas for evolving the ideas in this series do leave a comment!
Cheers -- Graham
Deploy a Dockerized Application to Azure Kubernetes Service using Azure YAML Pipelines 5 – Application Deployment Pipelines
This is the fifth post in a series where I'm taking a fresh look at how to deploy a dockerized application to Azure Kubernetes Service (AKS) using Azure Pipelines after having previously blogged about this in 2018. The list of posts in this series is as follows:
- Getting Started
- Terraform Development Experience
- Terraform Deployment Pipeline
- Running a Dockerized Application Locally
- Application Deployment Pipelines (this post)
- Telemetry and Diagnostics
In this post I deploy the MegaStore sample application that was introduced in the previous post to AKS using YAML Azure Pipelines. If you want to follow along you can clone / fork my repo here, and if you haven't already done so please take a look at the first post to understand the background, what this series hopes to cover and the tools mentioned in this post. I'm not covering Azure Pipelines basics here and if this is of interest take a look at this video and or this series of videos. I'm also assuming general familiarity with Azure DevOps and the Azure Portal.
For me this is probably the most exciting post in the series. I've been developing Azure Pipelines using YAML for a little while now and I love working in this way and wouldn't want to go back to classic pipelines ie GUI tasks.
Even though we're dealing with pipelines as code there's still a lot to configure, so let's get started!
Azure SQL qa and prd Databases
First configure the Azure SQL qa and prd databases created in a previous post. Using SQL Server Management Studio (SSMS) login to Azure SQL where Server name will be something like yourservername-asql.database.windows.net and Login and Password are the values supplied to the asql_administrator_login_name and asql_administrator_login_password Terraform variables. Once logged in create the following objects using the files in the repo's sql folder (use Ctrl+Shift+M in SSMS to show the Template Parameters dialog to add the qa and prd suffixes):
- SQL logins called sales_user_qa and sales_user_prd based on create-login-template.sql. Make a note of the passwords.
- In both the qa and prd databases users called sales_user and a table called Sale based on configure-database-template.sql.
Note: if you are having problems logging in to Azure SQL from SSMS make sure you have correctly set a firewall rule to allow your local workstation to connect.
Self-hosted Linux Agent
The MegaStore sample application uses Linux containers so we need a Linux agent running Docker to build them. The Microsoft ubuntu-latest agent will work but as noted in a previous post the Microsoft agents can be slow and you can't directly see what they are doing at the file system level. However, due to the magic of the newer versions of Docker Desktop and WSL 2 we can easily run a self-hosted Linux agent on a Windows 10 machine. The instructions for configuring a self-host agent can be found here and I assume that you have the prerequisites installed and configured as per the first post in this series. The high-level procedure is as follows:
- If you didn't create a new Agent Pool in Azure DevOps as part of a previous post, you'll need to create anew pool called Local at Organization Settings > Pipelines > Agent Pools > Add pool.
- On your Windows machine create a folder such as C:\agents\linux.
- Download the agent which will have a filename like vsts-agent-linux-x64-2.165.2.tar.gz. Move this file to C:\agents\linux (it's okay to do this in Windows Explorer).
- The tar file needs to be unzipped from an Ubuntu Bash prompt (ie Ubuntu running under WSL 2). Make sure you are at /mntc/agents/linux and then run tar zxvf vsts-agent-linux-x64-2.165.2.tar.gz (obviously substitute the correct filename as the version may have moved on by the time you read this). It took a couple of minutes on my machine.
- Now run ./config.sh to start the configuration process.
- You will need to supply your Azure DevOps server URL and previously created PAT.
- Use ubuntu-18.04 as the agent name and for this local instance I recommend not running as a service or at startup.
- The agent can be started by running ./run.sh at an Ubuntu Bash prompt after which you should see something this:

- After the agent has finished running a pipeline job you can examine the files in C:\agents\linux\_work (Windows Explorer works fine) to understand what happened and assist with troubleshooting any issues.
- The ubuntu-18.04 agent name will be used in a few pipelines so it's a good candidate for adding to the megastore variable group as local_linux_agent_name.
- Don't forget that you'll need Docker Desktop running to run any pipeline jobs that use Docker.
Create a Secure File to Authenticate to AKS
One of the techniques I'm demonstrating in this blog series and in this post in particular is how to take full control of the pipeline by working with command line tools rather than Azure Pipeline tasks. Whilst tasks undoubtedly have their place, for some command line tools I don't like the way that tasks abstract away what is going on and, because of the Swiss Army knife nature of some tasks, the way they sometimes force you to supply information that may not actually be used for a task sub-command.
The command line tool predominantly in use in this post is kubectl—used to issue commands to a Kubernetes cluster. When used locally kubectl works in conjunction with a kubeconfig file that specifies connection details to a cluster. On a Windows machine, by default kubectl is going to look in C:\Users\%USERNAME%\.kube for a kubeconfig file called config. That's not going to work in an Azure Pipeline (or any pipeline) so we need a different approach. It turns out that kubectl has a --kubeconfig parameter for specifying the path to a kubeconfig file. We can make use of this in Azure Pipelines by uploading the C:\Users\%USERNAME%\.kube\config file as a Secure files item. In the pipeline we can then call a task to download the file, which by default will be to $(Agent.TempDirectory). The procedure for configuring all this is as follows:
- Whilst logged in to the Azure CLI and with the correct Azure subscription set, run az aks get-credentials --resource-group yourResourceGroup --name yourAksCluster. This will create the config file at C:\Users\%USERNAME%\.kube.
- In Azure DevOps navigate to Pipelines > Library and click + Secure file.
- Use the Upload file dialog to Browse to and upload the config file. The new secure file item is named the same as the file.
- Use the ellipsis to the right of the new secure file item to edit it:

- Edit the secure file item so that Pipeline permissions is set to Authorize for use in all pipelines:

- Note that (at least at the time of writing) for some reason this change doesn't cause the Save link to light up but you can navigate away from the editor without losing changes.
Once you have the kubeconfig file installed on your local machine you can access the cluster's Dashboard by running az aks browse --resource-group yourResourceGroup --name yourAksCluster.
Create Kubernetes Namespaces
Two Kubernetes namespaces are needed that will be the deployment environments. The great thing about using namespaces is that exactly the same configuration can be applied to each namespace without any naming collisions. For example, the message queue URL is nats://message-queue-service:4222 and this same URL works in all environments without any clashes.
With the kubeconfig file installed as above namespaces can be created from the command line using kubectl create namespace qa and kubectl create namespace prd.
Configure a Pipeline Environment
From the docs: An environment is a collection of resources that can be targeted by deployments from a pipeline. At the time of writing only a couple of resource types are supported, one of them being Kubernetes. It's actually a very handy way of being able to see what's going on in the cluster, including the health of pods and being able to look at the logs for each pod. There's also some nice traceability. Configuration is mostly straightforward:
- In Azure DevOps navigate to Pipelines > Environments and click New Environment.
- In the dialog that appears set the Name to megastore, select Kubernetes then Next.
- In the next step select Azure Kubernetes Service as the Provider and follow through with the authentication procedure.
- For Namespace select Existing and select qa in the dropdown:

- Click Validate and create to complete the first part of the process.
- In the next screen that appears click Add resource and repeat the above process but this time for the prd namespace. The final result should be something like this:

- Create a variable called environment_name for the name of the environment in the megastore variable group.
- Note that I've never seen the Latest job column change from Never deployed despite doing many deployments. Something to investigate...
Generic Procedure for Creating a Pipeline from an Existing YAML File
Thee are four separate pipelines that need creating to deploy MegaStore to AKS and this is the generic procedure for creating them from existing YAML files assuming you have cloned / forked the repo on GitHub:
- In Azure DevOps navigate to Pipelines > Pipelines and click New pipeline.
- In the Connect tab choose GitHub as the location for your code.
- In the Select tab choose the appropriate repository, possibly using the dropdown to show All repositories rather than My repositories.
- In the Configure tab choose Existing Azure Pipelines YAML file and then in the window that pops, for Path select the required YAML file and click Continue.
- In the Review tab click the dropdown next to Run and click Save.
- The next screen you are presented with invites you to run the pipeline but before doing that click the vertical ellipsis / slimline hamburger menu next to the rightmost Run pipeline and select Rename / move:

- Overwrite Name with the desired name and click Save.
- The final step is to define any variables that are not defined in the pipeline itself. There are two options here: in the UI of the pipeline and in a variable group. More on this below.
Working With YAML Pipelines
Whilst it's possible to edit pipelines in Azure DevOps I've never bothered, and instead I prefer to use VS Code with the Azure Pipelines extension. By using a yml extension for pipeline file and a yaml extension for Kubernetes files it's possible to tell VS Code to associate just yml files with the pipelines extension using this in settings.json:
|
|
"files.associations": { "*.yml": "azure-pipelines" } |
If that convention doesn't work for you an alternative could be to add a prefix to your pipelines and use that to identify them to the extension.
For various reasons I spent a very long time refactoring and fine-tuning the pipelines used in this blog series (okay, I went down several rabbit holes) and I've tried to capture what I learned below.
Choose stage names to promote code reusability
I know it's not always possible but if you can match the stage names in the release part of the pipeline to the names of your actual environments then you can make use of predefined variables such as $(System.StageName) to write templates (see below) that can be reused in different stages possibly without any extra work. (If your stage and environment names can't match for whatever reason you can still pass in the environment name as a parameter to a template but it's extra work.) For MegaStore deployment I have two AKS environments (qa and prd) and these match the qa and prd stages of the pipelines.
Talking of stages there is also a first stage to each pipeline I call init as I think this is a better name than build when nothing is actually being built, but that's just a personal preference.
Consider how many jobs a pipeline needs and the type of job
A job in Azure Pipelines is the top level container for the work that actually happens. Jobs do a lot of stuff to get ready for this work which is all potential overhead for a pipeline. As a rule of thumb you probably want to use as few jobs as you can get away with, which at a minimum is one job per stage.
You should also appreciate the difference between standard and deployment jobs. In addition to the differences described in the documentation I've noticed that a deployment job doesn't perform a git checkout unlike a standard job, so it looks like Microsoft have optimised the deployment job for deployment as well as giving it some extra functionality. In the MegaStore pipelines I've used a standard job for the init stage and deployment jobs for the qa and prd stages.
Where to declare variables
Variables in Azure Pipelines is a pretty large and complex topic but these resources go a long way to help understand how they work and the different options:
In terms of where to declare variables, if they are just needed for that pipeline and are not secrets they should be declared in the pipeline itself. Variables that are needed across multiple pipelines should be declared in a variable group, which also allows for the management of variables that are secrets. The remaining scenario is where to store secrets that are only used in one pipeline. The official documentation advises using the pipeline settings UI, but I'm not certain if storing related variables and secrets in multiple locations might cause confusion and whether it's better to store related items together in a variable group. I will be using the pipeline settings UI in this post to illustrate the technique and will leave it to you to make your own mind up about whether it's a good idea to split related variables.
Giving a pipeline a custom run name
The name keyword at the beginning of each pipeline allows you to provide a custom name for each run of the pipeline. I've specified a Semantic versioning type name but there's lots of configurability.
How and when to clean the workspace
Whilst it may not always be appropriate, my general preference is to start each new run of a pipeline with a completely clean workspace so there is no chance of contamination from a previous run. Looking back in time it seems that in late 2019 the procedure for cleaning the workspace changed from cleaning at the pool level to the job level. Typically you only want to clean the workspace once per run and I've dealt with this by performing a clean in the init job of the init stage of each pipeline.
Versioning files used in the pipeline
The MegaStore pipelines call Kubernetes manifest files from the kubectl command line. (These are the YAML files in the k8s folder.) Since this folder exists on disk after the git checkout these files can be referenced directly from the command line. However, this is probably not a great idea because in theory it's possible to write a pipeline against a frequently changing repo that could end up using one version of a file in one stage of the pipeline and a different version in another.
A much better practice in my view is to package files in to an artifact and then make those packaged files available to the stages of the pipeline. An additional benefit of this approach is that the artifact is associated with the pipeline run and can be examined at a later date if you need to understand what was actually deployed. (Note that in the MegaStore pipelines I'm being a bit lazy in packaging the whole k8s folder but that isn't strictly necessary as not every file is used in each pipeline.)
By default a deployment job will try and download an artifact created in a previous part of the pipeline. In my pipelines I'm explicitly downloading the artifact in the init stage so I suppress this in the qa and prd stages using the download: none keyword.
Refactor the pipeline with templates
You can and should refactor your pipelines with templates. From the docs: Templates let you define reusable content, logic, and parameters. Templates function in two ways. You can insert reusable content with a template or you can use a template to control what is allowed in a pipeline. I'm using the first version here, ie to package reusable content.
Templates work at different levels, and can be used to reuse steps, jobs and stages. I started by creating job templates as it made the main pipeline much cleaner. However, I realised that the job templates in a stage were executing in any order, which definitely was not what I wanted. Other than possibly passing in a parameter to the template to control dependency I couldn't see an obvious way to set the execution order of jobs templates. This, in conjunction with my realising that there is some overhead to each job (see above) meant that I ditched job templates for step templates.
As an aside, one great thing I learned whilst using (the now abandoned) job templates was how to dynamically set the job name, as I wanted the job name to include the stage name. You can't simply append $(System.StageName) to the job name in a template because the job name needs to be evaluated before the pipeline executes. However, you can pass a parameter in to the template that uses the template expression syntax in the template which gets resolved during pipeline initialization. I couldn't stop smiling when I came across this feature.
A final thought about templates is that it's probably a good idea to make sure you don't take refactoring too far, as to me it feels like the single-responsibility principle ought to apply to templates. I fell foul of this by nesting a template in a template. There are valid reasons to do this but in my case the nested template had nothing to do with the parent template and I decided it was probably a bad idea.
Configuring and Running the MegaStore Pipelines
At long last we get to actually create the pipelines. You should follow the generic procedure above to create the following:
- megastore-config, with the following variables
- acr_authentication_secret_name = acrauth: in pipeline settings UI as plain text
- acr_name = ACR name from Azure Portal: in megastore variable group as plain text
- acr_password = ACR password from Azure Portal: in megastore variable group as secret
- appinsights_instrumentationkey_qa = App Insights qa key from Azure Portal: in pipeline settings UI as plain text
- appinsights_instrumentationkey_prd = App Insights prd key from Azure Portal: in pipeline settings UI as plain text
- db_password_qa = password generate above for sales_user_qa login
- db_password_prd = password generate above for sales_user_prd login
- db_server_name = Azure SQL server name without the megastoreprm-asql.database.windows.net element
- megastore-message-queue
- megastore-savesalehandler
- megastore-web
The first pipeline to run should be megastore-config as this sets up environment variables used by other pipelines. In a stable system (ie not in active development / test cycle) this pipeline wouldn't be needed again unless any of the environment variables change.
The next pipeline to run is megastore-message-queue as it doesn't have dependencies. The pipeline creates a Kubernetes Service to expose pod(s) running the NATS message queue which are deployed using a Kubernetes Deployment. For this demo setup the NATS Docker image is pulled directly from Docker Hub so there is no interaction with Azure Container Registry. Again, once deployed this pipeline would only needed to be deployed infrequently.
The final pipelines can be run in any order. The megastore-savesalehandler pipeline only consists of a deployment because nothing needs to connect to it all it does is monitor the message queue. The megastore-web pipeline requires both a service and a deployment because we want to talk to the pod(s) from the outside world. In both cases the init stage of the pipeline runs a series of commands to build a new image and upload it to Azure Container Registry tagged with the build number. The kubectl set image command ensures that the image with the correct build number is deployed. With a changing application these pipelines would be deployed as required to release new features. These application components can be developed and deployed independently of each other but will reply on testing in Visual Studio to make sure nothing is broken.
That's it Folks!
I'm aware that there is a lot of small moving parts here and lots of scope for things to be missed. If you are following along and getting errors please leave a comment and I'll try to help. Missing or misspelt variables are a common thing that trip me up.
For me, the big takeaway from this post is that I've found writing YAML Azure Pipelines to be a very enjoyable and extremely productive way to develop deployment pipelines. If you haven't tried them I urge you to give it a go. You might be pleasantly surprised.
Next time we change gears completely and look at how Application Insights fits in to all of this.
Cheers -- Graham
Deploy a Dockerized Application to Azure Kubernetes Service using Azure YAML Pipelines 4 – Running a Dockerized Application Locally
This is the fourth post in a series where I'm taking a fresh look at how to deploy a dockerized application to Azure Kubernetes Service (AKS) using Azure Pipelines after having previously blogged about this in 2018. The list of posts in this series is as follows:
- Getting Started
- Terraform Development Experience
- Terraform Deployment Pipeline
- Running a Dockerized Application Locally (this post)
- Application Deployment Pipelines
- Telemetry and Diagnostics
In this post I explain the components of the sample application I wrote to accompany this (and the previous) blog series and how to run the application locally. If you want to follow along you can clone / fork my repo here, and if you haven't already done so please take a look at the first post to understand the background, what this series hopes to cover and the tools mentioned in this post. Additionally, this post assumes you have created the infrastructure—or at least the Azure SQL dev database—described in the previous Terraform posts.
MegaStore Application
The sample application is called MegaStore and is about as simple as it gets in terms of a functional application. It's a .NET Core 3.1 application and the idea is that a sales record (beers from breweries local to me if you are interested) is created in the presentation tier which eventually gets persisted to a database via a message queue. The core components are:
- MegaStore.Web: a skeleton ASP.NET Core application that creates a ‘sales' record every time the home page is accessed and places it on a message queue.
- NATS message queue: this is an instance of the nats image on Docker Hub using the default configuration.
- MegaStore.SaveSaleHandler: a .NET Core console application that monitors the NATS message queue for new records and saves them to an Azure SQL database using EF Core.
When running locally in Visual Studio 2019 these application components work together using Docker Compose, which is a separate project in the Visual Studio solution. There are two configuration files in use which get merged together:
- docker-compose.yml: contains the configuration for megastore.web and megastore.savesalehandler which is common to running the application both locally and in the deployment pipeline.
- docker-compose.override.yml: contains additional configuration that is only needed locally.
There's a few steps you'll need to complete to run MegaStore locally.
Azure SQL dev Database
First configure the Azure SQL dev database created in the previous post. Using SQL Server Management Studio (SSMS) login to Azure SQL where Server name will be something like yourservername-asql.database.windows.net and Login and Password are the values supplied to the asql_administrator_login_name and asql_administrator_login_password Terraform variables. Once logged in create the following objects using the files in the repo's sql folder (use Ctrl+Shift+M in SSMS to show the Template Parameters dialog to add the dev suffix):
- A SQL login called sales_user_dev based on create-login-template.sql. Make a note of the password.
- In the dev database a user called sales_user and a table called Sale based on configure-database-template.sql.
Note: if you are having problems logging in to Azure SQL from SSMS make sure you have correctly set a firewall rule to allow your local workstation to connect.
Docker Environment File
Next create a Docker environment file to store the database connection string. In Visual Studio create a file called db-credentials.env in the docker-compose project. All on one line add the following connection string, substituting in your own values for the server name and sales_user_dev password:
|
|
DB_CONNECTION_STRING=Server=tcp:yourservername.database.windows.net,1433;Initial Catalog=dev;Persist Security Info=False;User ID=sales_user_dev;Password=yourpassword;MultipleActiveResultSets=False;Encrypt=True;TrustServerCertificate=False;Connection Timeout=30; |
Note: since this file contains sensitive data it's important that you don't add it to version control. The .gitignore file that's part of the repo is configured to ignore db-credentials.env.
Application Insights Key
In order to collect Application Insights telemetry from a locally running MegaStore you'll need to edit docker-compose.override.yml to contain the instrumentation key for the dev instance of the Application Insights resource that was created in the the previous post. You can find this in the Azure Portal in the Overview pane of the Application Insights resource:

I'll write more about Application Insights in a later post but in the meantime if you want to know more see this post from my previous 2018 series. It's largely the same with a few code changes for newer ways of doing things with updated NuGet packages.
Set docker-compose as Startup
The startup project in Visual Studio needs to be set to docker-compose by right-clicking docker-compose in the Solution Explorer and selecting Set as Startup Project:
Up and Running
You should now be able to run MegaStore using F5 which should result in a localhost+port number web page in your browser. Docker Desktop will need to be running however I've noticed that newer versions of Visual Studio offer to start it automatically if required. Notice in Visual Studio the handy Containers window that gives some insight into what's happening:

In order to establish everything is working open SSMS and run select-from-sales.sql (in the sql folder in the repo) against the dev database. You should see a new ‘beer' sales record. If you want to create more records you can keep reloading the web page in your browser or run the generate-web-traffic.ps1 PowerShell snippet that's in the repo's pipeline folder making sure that the URL is something like http://localhost:32768/ (your port number will likely be different).
To view Application Insights telemetry (from the Azure Portal) whilst running MegaStore locally you may need to be aware of services running on you network that could cause interference. For me I could run Live Metrics and see activity in most of the graphs, however I initially couldn't use the Search feature to see trace and request telemetry (the screenshot is what I was expecting to see):

I initially thought this might be a firewall issue but it wasn't, and instead it turned out to be the pi-hole ad blocking service I have running on my network. It's easy to disable pi-hole for a few minutes or you can figure out which URL's need whitelisting. The bigger picture though is that if you don't see telemetry—particularly in a corporate scenario—you may have to do some investigation.
That's it for now! Next time we look at deploying MegaStore to AKS using Azure Pipelines.
Cheers -- Graham
Deploy a Dockerized Application to Azure Kubernetes Service using Azure YAML Pipelines 3 – Terraform Deployment Pipeline
This is the third post in a series where I'm taking a fresh look at how to deploy a dockerized application to Azure Kubernetes Service (AKS) using Azure Pipelines after having previously blogged about this in 2018. The list of posts in this series is as follows:
- Getting Started
- Terraform Development Experience
- Terraform Deployment Pipeline (this post)
- Running a Dockerized Application Locally
- Application Deployment Pipelines
- Telemetry and Diagnostics
In this post I take a look at how to create infrastructure in Azure using Terraform in a deployment pipeline using Azure Pipelines. If you want to follow along you can clone / fork my repo here, and if you haven't already done so please take a look at the first post to understand the background, what this series hopes to cover and the tools mentioned in this post. I'm not covering Azure Pipelines basics here and if this is of interest take a look at this video and or this series of videos. I'm also assuming familiarity with Azure DevOps.
There's quite a few moving parts to configure to move from command-line Terraform to running it in Azure Pipelines so here's the high-level list of activities:
- Create a Variable Group in Azure Pipelines as a central place to store variables and secrets that can be used across multiple pipelines.
- Configure a self-hosted build agent to run on a local Windows machine to aid troubleshooting.
- Create storage in Azure to act as a backend for Terraform state.
- Generate credentials for deployment to Azure.
- Create variables in the variable group to support the Terraform resources that need variable values.
- Configure and run an Azure Pipeline from the megastore-iac.yml file in the repo.
Create a Variable Group in Azure Pipelines
In your Azure DevOps project (mine is called megastore-az) navigate to Pipelines > Library > Variable Groups and create a new variable group called megastore. Ensure that Allow access to all pipelines is set to on. Add a variable named project_name and give it a meaningful value that is also likely to be globally unique and doesn't contain any punctuation and click Save:

Configure a Self-Hosted Agent to Run Locally
While a Microsoft-hosted windows-latest agent will certainly be quite satisfactory for running Terraform pipeline jobs they can be a little bit slow and there is no way to peek in and see what's happening in the file system which can be a nuisance if you are trying to troubleshoot a problem. Additionally, because a brand new instance of an agent is created for each new request they mask the issue of files hanging around from previous jobs. This can catch you out if you move from a Microsoft-hosted agent to a self-hosted agent but is something that you will certainly catch and fix if you start with a self-hosted agent. The instructions for configuring a self-host agent can be found here. The usual scenario is that you are going to install the agent on a server but the agent works perfectly well on a local Windows 10 machine as long as all the required dependencies are installed. The high-level installation steps are as follows:
- Create a new Pool in Azure DevOps called Local at Organization Settings > Pipelines > Agent Pools > Add pool.
- On your Windows machine create a folder such as C:\agents\windows.
- Download the agent and unzip the contents.
- Copy the contents of the containing folder to C:\agents\windows, ie this folder will contain two folders and two *.cmd files.
- From a command prompt run .\config.cmd.
- You will need to supply your Azure DevOps server URL and previously created PAT.
- Use windows-10 as the agent name and for this local instance I recommend not running as a service or at startup.
- The agent can be started by running .\run.cmd at a command prompt after which you should see something this:

- After the agent has finished running a pipeline job you can examine the files in C:\agents\windows\_work to understand what happened and assist with troubleshooting any issues.
Create Backend Storage in Azure
The Azure backend storage can be created by applying the Terraform configuration in the backend folder that is part of the repo. The configuration outputs three key/value pairs which are required by Terraform and which should be added as variables to the megastore variable group. The backend_storage_access_key should be set as a secret with the padlock:

Generate Credentials for Deployment to Azure
There are several pieces of information required by Terraform which can be obtained as follows (assumes you are logged in to Azure via the Azure CLI—run az login if not):
- Run az account list --output table which will return a list of Azure accounts and corresponding subscription Ids.
- Run az ad sp create-for-rbac --role="Contributor" --scopes="/subscriptions/SubscriptionId", substituting SubscriptionId for the appropriate Id from step 1.
- From the resulting output create four new variables in the megastore variables group as follows:
- azure_subscription_id = SubscriptionId from step 1
- azure_client_id = appId value from the result of step 2
- azure_tenant_id = tenant value from the result of step 2
- azure_client_secret = password value from the result of step 2, which should set as a secret with the padlock
- Remember to save the variable group after entering the new values.
Create Terraform Variable Values in the megastore Variable Group
In the previous post where we ran Terraform from the command-line we supplied variable values via dev.tfvars, a file that isn't committed to version control and is only available for local use. These variable values need creating in the megastore variable group as follows, obviously substituting in the appropriate values:
- aks_client_id = "service principal id for the AKs cluster"
- aks_client_secret = "service principal secret for the AKs cluster"
- asql_administrator_login_name = "Azure SQL admin name"
- asql_administrator_login_password = "Azure SQL admin password"
- asql_local_client_ip_address = "local ip address for your client workstation"
Remember to save the variable group after entering the new values.
Configure an Azure Pipeline
The pipeline folder in the repo contains megastore-iac.yml which contains all the instructions needed to automate the deployment of the Terraform resources in an Azure Pipeline. The pipeline is configured in Azure DevOps as follows:
- From Pipelines > Pipelines click New pipeline.
- In Connect choose GitHub and authenticate if required.
- In Select, find your repo, possibly by selecting to show All repositories.
- In Configure choose Existing Azure Pipelines YAML file and in Path select /pipeline/megastore-iac.yml and click Continue.
- From the Run dropdown select Save.
- At the Run Pipeline screen use the vertical ellipsis to show its menu and then select Rename/move:

- Rename the pipeline to megastore-iac and click Save.
- Now click Run pipeline > Run.
- If the self-hosted agent isn't running then from a command prompt navigate to the agent folder and run .\run.cmd.
- Hopefully watch with joy as the megastore Azure infrastructure is created through the pipeline.
Analysis of the YAML File
So what exactly is the YAML file doing? Here's an explanation for some of the schema syntax with reference to a specific pipeline run and the actual folders on disk for that run (the number shown will vary between runs but otherwise everything else should be the same):
- name: applies a custom build number
- variables: specifies a reference to the megastore variable group
- pool: specifies a reference to the local agent pool and specifically to the agent we created called windows-10
- jobs/job/workspace: ensures that the agent working folders are cleared down before a new job starts
- script/'output environemt variables': dumps all the environment variables to the log for diagnostic purposes
- publish/'publish iac artefact': takes the contents of the git checkout at C:\agents\windows\_work\3\s\iac and packages them in to an artifact called iac.
- download/'download iac artefact': downloads the iac artifact to C:\agents\windows\_work\3\iac.
- powershell/'create file with azurerm backend configuration': we need to tell Terraform to use Azure for the backend through a configuration. This configuration can't be present when working locally so instead it's created dynamically through PowerShell with some formatting commands to make the YAML structurally correct.
- script/'terraform init': initialises Terraform in C:\agents\windows\_work\3\iac using Azure as the backend through credentials supplied on the command line from the megastore variable group.
- script/'terraform plan and apply': performs a plan and than an apply on the configurations in C:\agents\windows\_work\3\iac using the credentials and variables passed in on the command line from the megastore variable group.
Final Thoughts
Although this seems like a lot of configuration—and it probably is—the ability to use pipelines as code feels like a significant step forward compared with GUI tasks. Although at first the YAML can seem confusing once you start working with it you soon get used to it and I now much prefer it to GUI tasks.
One question which I'm still undecided about is where to place some of the variables needed by the pipeline. I've used a variable group exclusively as it feels better for all variables to be in one place, and for variables used across different pipelines this is definitely where they should be. However, variables that are only used by one pipeline could live with the pipeline itself, as this is a fully supported feature (editing the pipeline in the browser lights up the Variables button where variables for that pipeline can be added). However having variables scattered everywhere could be confusing, hence my uncertainty. Let me know in the comments if you have a view!
That's it for now. Next time we look at running the sample application locally using Visual Studio and Docker Desktop.
Cheers -- Graham
Deploy a Dockerized Application to Azure Kubernetes Service using Azure YAML Pipelines 2 – Terraform Development Experience
This is the second post in a series where I'm taking a fresh look at how to deploy a dockerized application to Azure Kubernetes Service (AKS) using Azure Pipelines after having previously blogged about this in 2018. The list of posts in this series is as follows:
- Getting Started
- Terraform Development Experience (this post)
- Terraform Deployment Pipeline
- Running a Dockerized Application Locally
- Application Deployment Pipelines
- Telemetry and Diagnostics
In this post I take a look at how to create infrastructure in Azure using Terraform at the command line. If you want to follow along you can clone or fork my repo here, and if you haven't already done so please take a look at the first post to understand the background, what this series hopes to cover and the tools mentioned in this post. I'm not covering Terraform basics here and if you need this take a look at this tutorial.
Working With Terraform Files in VS Code
As with most code I write, I like to distinguish between what's sometimes called the develop inner loop and the deployment pipeline. The developer inner loop is where code is written and quickly tested for fast feedback, and the deployment pipeline is where code is committed to version control and then (usually) built and deployed and subjected to a variety of tests in different environments or stages to ensure appropriate quality.
Working with infrastructure as code (IaC) against a cloud platform is obviously different from developing an application that can run completely locally, but with Terraform it's reasonably straightforward to create a productive local development experience.
Assuming you've forked my repo and cloned the fork to a suitable location on your Windows machine, open the repo's root folder in VS Code. You will probably want to install the following extensions if you haven't already:
The .gitignore file in the root of the repo contains most of the recommended settings for Terraform plus one of my own:
|
|
# Local .terraform directories **/.terraform/* # .tfstate files *.tfstate *.tfstate.* # Crash log files crash.log # developer tfvars file dev.tfvars |
The following files in the iac folder are of specific interest to my way of working locally with Terraform:
- variables.tf: Here I declare variables here but don't provide default values.
- terraform.tfvars: Here I provide values for all variables that are common to working both locally and in the deployment pipeline, and which aren't secrets.
- dev.tfvars: Here I provide values for all variables that are specific to working locally or which are secrets. Crucially this file is omitted from being committed to version control, and the values supplied by dev.tfvars locally are supplied in a different way in the deployment pipeline. Obviously you won't have this file and instead I've added dev.txt as a proxy for what your copy of dev.tfvars should contain.
- versions.tf: Here I specify the minimum versions of Terraform itself and the Azure Provider.
The other files in the iac folder should be familiar to anyone who has used Terraform and consist of configurations for the following Azure resources:
With all of the configurations I've taken a minimalist approach, partly to keep things simple and partly to keep Azure costs down for anyone who is looking to eek out free credits.
Running Terraform Commands in VS Code
What's nice about using VS Code for Terraform development is the integrated terminal. For fairly recent installations of VS Code a new terminal (Ctrl+Shift+') will create one of the PowerShell variety at the rood of the repo. Navigate to the iac folder (ie cd iac) and create dev.tfvars based on dev.txt, obviously supplying your own values. Next run terraform init.
As expected a set of new files is created to support the local Terraform backend, however these are a distraction in the VS Code Explorer. We can fix this, and clean the Explorer up a bit more as well:
- Access the settings editor via File > Preferences > Settings.
- Ensuring you have the User tab selected, in Search settings search for files:exclude.
- Click Add Pattern to add a glob pattern.
- Suggested patterns include:
- **/.terraform
- **/*.tfstate*
- **/.vscode
- **/LICENSE
To be able to deploy the Terraform configurations to Azure we need to be logged in via the Azure CLI:
- At the command prompt run az login and follow the browser instructions to log in.
- If you have access to more than one Azure subscription examine the output that is returned to check that the required subscription is set as the default.
- If necessary run az account set --subscription "subscription_id" to set the appropriate subscription.
You should now be able to plan or apply the configurations however there is a twist because we are using a custom tfvars file in conjunction with terraform.tfvars (which is automatically included by convention). So the correct commands to run are terraform plan -var-file="dev.tfvars" or terraform apply -var-file="dev.tfvars", remembering that these are specifically for local use only as dev.tfvars will not be available in the deployment pipeline and we'll be supplying the variable values in a different way.
That's it for this post. Next time we look at deploying the Terraform configurations in an Azure Pipeline.
Cheers -- Graham
Deploy a Dockerized Application to Azure Kubernetes Service using Azure YAML Pipelines 1 – Getting Started
In 2018 I wrote a series of blog posts about deploying a dockerized ASP.NET Core application to Azure Kubernetes Service (AKS) and finished up with this post where for various reasons I abandoned the Deploy to Kubernetes GUI tasks used by what was then VSTS and instead made use of refactored Bash scripts to deploy Kubernetes resources.
In the 2018 series of posts I didn't start out with infrastructure as code (IaC) and also since then a lot has changed with the tooling and the technology so in my next few posts I'm going to revisit this topic to see how things look in 2020. The blog series at the moment is looking like this:
- Getting Started (this post)
- Terraform Development Experience
- Terraform Deployment Pipeline
- Running a Dockerized Application Locally
- Application Deployment Pipelines
- Telemetry and Diagnostics
As with my previous 2018 series of posts I'm not suggesting that the ideas I'm presenting are the best and only way to do things. Rather, the intention is that the concepts offer a potential learning opportunity and a stepping stone to figuring out how you might approach this in a real-world scenario. Even if you don't need to use any of this in production I think there's a great deal of fun and satisfaction to be had from gluing all of the bits together.
The Big Picture
The dockerized application that I'll be deploying to AKS consists of the following components:
- An ASP.NET Core web application, that sends messages to a
- NATS message queue service, which stores messages to be retrieved by a
- .NET Core message queue handler application, which saves messages to an
- Azure SQL Database
The lifecycle of this application and the infrastructure it runs on is as follows:
- All Azure resources are managed by Terraform using Azure Pipelines. These include a Container Registry, an AKS Cluster, an Azure SQL Database server and databases and Application Insights instances.
- An AKS cluster is configured with two namespaces called qa and prd which form a basic CI/CD pipeline.
- An Azure SQL Database server is configured with three databases called dev, qa and prd.
- Application components (except the Azure SQL Database) run locally in a dev environment using docker-compose. Messages are saved to the dev Azure SQL Database.
- Deployments of application components (except the Azure SQL Database) are managed separately using dedicated Azure Pipelines. The Container Registry is used to store tagged images and new images are first pushed to the qa and then to the prd namespaces on the AKS cluster.
- Telemetry and diagnostics are collected by three separate Application Insights instances, one each for the three (dev, qa and prd) environments.
The overall aim of this series is to show how the big pieces of the jigsaw fit together and I'm intentionally not covering any of the lower-level details commonly associated with CI/CD pipelines such as testing. Maybe some other time!
What You Can Learn by Following This Blog Series
Some of the technologies I'm using in this blog series are vast in scope and I can only hope to scratch the surface. However this is a list of some of the things that you can learn about if you follow along with the series:
- The great range of tools we now have that support running Linux on Windows via WSL 2.
- An example of the Terraform developer inner loop experience and how to extend that to running Terraform in a deployment pipeline using Azure Pipelines.
- Assistance with debugging Azure Pipelines by running self-hosted agents (both Windows and Linux flavours) on a Windows 10 machine.
- Creating Azure Pipelines as pipeline as code using YAML files, including the use of templates to aid reusability and deployment jobs to target an environment.
- How to avoid using Swiss Army Knife-style Azure Pipelines tasks and instead use native commands tuned exactly to a situation's requirements.
- How to segment telemetry and diagnostics for each stage of the CI/CD pipeline using separate Application Insights resources.
Tools You Will Need / Want
There is a long list of tools needed for this series and getting everything installed and configured is quite an exercise. However you may have some of this already and it can also be great fun getting the newer stuff working. Some of the tools can be installed with Chocolatey and it's definitely worth checking this out if you haven't already. Generally, I've listed the tools in the order you will need them so you don't need to install everything before working through the next couple of posts in the series. Everything in the list should be installed in Windows 10. There are some tools that need installing in the Ubuntu distro but I cover that in the relevant post.
That's it for this post. Next time we start working with Terraform at the command line.
Cheers -- Graham
Azure DevOps Hidden Gems #8 – Turn Azure Board Queries into Dashboard Chart Items
I've been working with what we now call Azure DevOps for many years and I'm constantly amazed by features I never knew existed or which I vaguely knew existed but hadn't fully appreciated. In this blog post series I'm attempting to shine a light on some of these hidden gems for the benefit of others. The full list of posts is here and if you have any suggestions for other posts please leave a comment!
I was recently helping someone proficient in Jira find the equivalent feature in Azure DevOps. They were trying to find an Azure DevOps Dashboard widget that would display a pie chart of work items segmented by owner. Whilst there are a couple of widgets that report against work items they are quite limited and likely not what you want. It's not really a problem though because a powerful and flexible solution exists!
As the title of the blog has already given away, it's possible to turn Azure Board Queries into charts that can be displayed on Dashboards. The first step is to navigate to Boards > Queries and create a query:

Then, and crucially, save the query as a Shared Query:

Now in the query menu bar switch from Editor to Charts and click New Chart:

There are plenty of options to choose from but I've created a pie chart grouped by Assigned To:

Click OK to save the chart and then use the ellipsis to Add to dashboard:

You will now be able to select the dashboard you want the chart to appear on. You can make further edits to the chart from the dashboard using the widget's ellipsis but note that if you do so the chart will become unlinked from the query. There's not really much more to it but if you do want to dig deeper the official documentation is here.
Hope this helps!
Cheers -- Graham
Azure DevOps Hidden Gems #7 – Keyboard Shortcuts
I've been working with what we now call Azure DevOps for many years and I'm constantly amazed by features I never knew existed or which I vaguely knew existed but hadn't fully appreciated. In this blog post series I'm attempting to shine a light on some of these hidden gems for the benefit of others. The full list of posts is here and if you have any suggestions for other posts please leave a comment!
Until recently if you'd asked me if Azure DevOps supported keyboard shortcuts I'd have guessed at yes because, well, it's a Microsoft product and that's what they would do, however I'd have had to perform a web search to get any more details. So imagine my surprise and delight when I stumbled on the Keyboard shortcuts for Azure DevOps and Team Explorer page in the official documentation and realised that Azure DevOps is positively teeming with keyboard shortcuts!
My enthusiasm was initially tempered slightly by the last updated date of the page (January 2017 as I write, making me feel that the page hadn't received any love for a while, however it's an oversight as the page has been updated with Azure DevOps references) but also due to the fact that some of the shortcuts don't seem to work. In particular, the shortcuts at the organisation level didn't work for me. Perhaps this is because the UI is in a state of flux and the shortcuts haven't caught up—who knows?
However, once you have drilled-in to a project then shortcuts (or most of them) certainly do work and can really speed up your navigation both between the different core areas of Azure DevOps and also within an area. In particular I love the Global g-series shortcuts for moving between core areas:

These g-series shortcuts can really make you zip around Azure DevOps like you had written the UI yourself! Within each area of Azure DevOps there are more shortcuts for that area, for example these are the ones for the Repos area:

Of course the problem with shortcuts is remembering them. If you are working with Azure DevOps on a reasonably regular basis as I am then the -g-series are definitely worth memorising. If you spend a lot of time in one of the specific areas then it may well pay off to master the shortcuts for that area as well.
Hope this helps!
Cheers -- Graham
Setting up a Raspberry Pi Kubernetes Cluster (with Blinkt! Strips that Show Number of Pods per Node!) Using k3sup
If, like me, you are interested in the worlds of both Raspberry Pi and Kubernetes you may have built or considered building a Raspberry Pi Kubernetes cluster (see here for just one of many examples). I built a three-unit cluster in early 2018 using Raspberry Pi 3 Model B+ boards and bootstrapped Kubernetes using an early version of Alex Ellis' guide and it was all pretty straightforward. By itself it's not a great thing to demo (in my case at my local Raspberry Jam for example) as there is no display so a nice improvement is to fit Pimoroni Blinkt! LED strips to the GPIO pins of each unit and then use the guide here to make the LEDs light up according to the number of pods that have been deployed. The Blinkt! improvement went fine and was working nicely—right up to the day when I decided to upgrade the Raspberry Pi OS from Raspbian Stretch to Raspbian Buster (which came out to support the new Raspberry Pi 4 model).
The first problem was that Docker wouldn't install on Buster but that was solved through a post by Alex Ellis. However I encountered other problems such as the swapfile not turning off between reboots and (critically) the Weave networking pods failing to start and I spent a lot of time messing around to no avail. The sensible option would have been to revert to Raspbian Stretch but by now I had the bit between my teeth and I wasn't giving up lightly. After even more messing about trying different configurations and getting nowhere I decided to follow Alex Ellis' advice and try k3s—a stripped-down version of Kubernetes from Rancher Labs (the k3s name is a twist on the often-used k8s abbreviation for Kubernetes). In fact, you can make things even easier by using Alex's k3sup tool to automate most of the process.
TL;DR: I had everything up-and-running on Raspbian Buster in next no time at all, including the Blinkt! LED strips displaying the number of pods on each node!

If you are looking to learn bare-metal Kubernetes installation then k3s/k3sup may not be for you. But if you just want to get a cluster configured with minimal fuss then it's just the ticket. As always there were a few twists and turns so here is a write-up of what worked for me, although I'm not documenting every single step because it's already well covered by Alex. I'm using a Windows 10 development machine so this write-up is from that perspective, however Alex's documentation is more Linux/macOS focused so everyone should be able to follow along.
Install k3s Using k3sup
I used three guides that together provided a complete picture for installing k3s on the Raspberry Pi platform using k3sup:
- Will it cluster? k3s on your Raspberry Pi
- Kubernetes Homelab with Raspberry Pi and k3sup
- k3sup
Use the first guide to (if necessary) build your cluster and then prepare each Pi. In addition to setting the GPU memory split, changing the hostname and changing the password for each Pi I also expanded the filesystem to use all of the SD card. You will need the IP addresses of your master and worker nodes so setting static IP addresses is a good way to go.
Follow the first guide up to and including Enable container features. I simply used sudo nano /boot/cmdline.txt to edit the file being careful not to add an extra line.
Use guides 2 and 3 to install k3s using k3sup. The key point to understand here is that you run k3sup from your development machine. As I'm running Windows 10 it was a case of grabbing the Windows binary from the k3sup releases page and copying it to my working folder for this project. On Windows bootstrapping the master node is simply a matter of opening a command prompt at your working folder and running this command, replacing $SERVER with the IP address of the master node:
|
|
k3sup install --ip $SERVER --user pi |
Bootstrapping the worker nodes is similarly straightforward:
|
|
k3sup join --ip $AGENT --server-ip $SERVER --user pi |
where $AGENT is the IP of the worker node and $SERVER the IP of the master node.
Communicating with the Cluster using kubectl
The k3s installation includes kubectl so from this point on it's just like working with any standard Kubernetes cluster. You'll obviously need kubectl installed on your development machine, and then you configure kubectl to talk to the cluster using whichever of the several techniques works best for you, using the kubeconfig file that is handily copied to the working folder on your workstation. In my case I chose simply to copy kubeconfig to ~\.kube\ (which had been previously created through working with Azure Kubernetes Service but you can create it yourself) and rename kubeconfig to config to end up with C:\Users\Graham\.kube\config. Running kubectl get nodes establishes that everything is (hopefully!) working correctly.
Configuring the Cluster so Pimoroni Blinkt! LED strips Indicate the Number of Pods per Node
The master guide to follow is here. With the Blinkt! LED strips installed you'll need to download the following files from the guide's repo to your working folder:
- kubernetes/blinkt-k8s-controller-rbac.yaml
- kubernetes/blinkt-k8s-controller-ds.yaml
You'll also need to create a manifest containing a deployment. Create a file in the working folder called deployment.yaml and copy the following:
1 2 3 4 5 6 7 8 9 10 11 12 13 14 15 16 17 18 19 |
apiVersion: apps/v1 kind: Deployment metadata: name: busybox-httpd labels: blinkt: show spec: replicas: 5 selector: matchLabels: blinkt: show template: metadata: labels: blinkt: show spec: containers: - name: busybox-httpd image: hypriot/rpi-busybox-httpd |
Now run the following commands against the cluster, from a command prompt at the working folder:
- kubectl label node $NODE_NAME deviceType=blinkt (where $NODE_NAME is the name of each node with a Blinkt! strip)
- kubectl create -f blinkt-k8s-controller-rbac.yaml
- kubectl create -f blinkt-k8s-controller-ds.yaml
- kubectl apply -f deployment.yaml
At this point you should see five LEDs light up according to how Kubernetes has decided which nodes the five pods should run on. You can now open deployment.yaml in your favourite code editor and play around with the number of replicas, repeating the final command above after saving each change to the file. Watch in joy as pods are created with a green flash and destroyed with a red flash, and settle on a satisfying blue (which you can change in blinkt-k8s-controller-ds.yaml ) for running pods.
Final Thoughts
I've been thrilled with how easy k3sup makes installing k3s and even if you do want to experience the pain thrill of the kubeadm procedure on Raspberry Pi I would still recommend you check out Alex's posts mentioned here and others on his blog as they offer tremendous extra value and learning.
Cheers -- Graham
Azure DevOps Hidden Gems #6 – Use the Manual Intervention Task to Pause a Stage of the Release Pipeline
I've been working with Azure DevOps quite a lot recently (having used its predecessors for many years) and I'm constantly amazed by features I never knew existed or which I vaguely knew existed but hadn't fully appreciated. In this blog post series I'm attempting to shine a light on some of these hidden gems for the benefit of others. The full list of posts is here and if you have any suggestions for other posts please leave a comment!
If you've created a release pipeline in Azure DevOps you probably know that there is rich functionality for approvals and gates to control a deployment between stages of the pipeline. Approvals are as you would imagine: a requirement for one or more people to approve either that a release stage is allowed to proceed or that a release stage has completed successfully. Gates are slightly different. From the docs: "Gates allow you to configure automated calls to external services, where the results are used to approve or reject a deployment. You can use gates to ensure that the release meets a wide range or criteria, without requiring user intervention.":

That's all well and good for controlling the deployment between stages of a pipeline. But what if you need to control the flow within a stage of a pipeline?
A colleague and I had this requirement recently when designing a release pipeline to manage the creation and updating of resources in Azure using Terraform, the cross-platform infrastructure as code technology from HashiCorp. One of the useful features of Terrafrom is the ability to call a command that will work out which resources are going to be created, destroyed or updated for a given Terraform configuration. A bit like the -WhatIf parameter in PowerShell if you are familiar with that. The problem in our scenario is that we need to halt the pipeline part way through a stage so someone can look at what Terraform is about to do and decide if it makes sense, and abort the stage if it doesn't. There is a solution of course, and it's the Manual Intervention task.
The task is simplicity itself to use, although it does need to run in the context of an Agentless job. Don't forget to add this or you will search in vain for the Manual Intervention task:

With the Manual Intervention task added to the Agentless job it's just a matter of setting a few properties:

When the pipeline is running it halts at the Manual Intervention task and waits for an intervention to either Resume or Reject the release:

If you weren't aware of this task you might be tempted to split a stage in to two stages to handle this scenario. Whilst this would probably work to my mind it's messy and inelegant and you should certainly check out the Manual Intervention task first.
Hope this helps!
Cheers -- Graham


