Continuous Delivery with TFS: Enable Test Impact Analysis
Test Impact Analysis is a feature that first appeared with Visual Studio / Microsoft Test Manager 2010 and provides for the ability to recommend tests that should be re-run in response to changes that have been made at the code level. It's a very useful feature but it does need some configuration before it can be used. In this post in my series on continuous delivery with TFS we look at the steps that need to be taken to enable TIA in our development pipeline.
Setting the Scene
The scenario I'm working with is where a new nightly build of the sample ASP.NET application has been deployed to the DAT stage and all of the automated Selenium web tests have passed. This now leaves the build ready to deploy in to the DQA stage so that any manual tests (including manual tests that have been automated to run from MTM) can be run from a browser on a client workstation. With TIA configured there are then at least two places to check for any tests that are recommended for running again.
Whilst working through the configuration for TIA I discovered that TIA doesn't seem to work in a multi-tenant web server, which is what I've set up for this blog post series to keep the number of VMs to a minimum. More correctly, I suspect that TIA doesn't work where there is a separate application pool for each website in a multi-tenant web server. I haven't investigated this thoroughly but it's something to bear in mind if you are trying to get TIA working and something I'll address in my future blog post series on continuous delivery with TFS 2015. The MSDN guidance for setting up TIA is here but it's slightly at odds with the latest version of MTM and in any case doesn't have all the details.
Create a Lab Center Environment and a Test Settings Configuration
As good a starting point as any for TIA configuration is to create a new environment in the MTM Lab Center. I covered this here so I won't go through all the steps again, however the environment needs to contain the web server that hosts the DQA stage's web site and it should be configured for the Web Server role.
Now move over to Test Settings and create a new entry -- I called mine Manual Test Run. Choose Manual for the What type of tests do you want to run? question and then in the Roles page select Web Server to join the Local role which is pre-selected and mandatory. In the Data and Diagnostics page the Local role needs to be configured for ASP.NET Client Proxy for IntelliTrace and Test Impact as a minimum and the Web Server role needs to be configured for Test Impact as a minimum. Additionally, after selecting Test Impact click on Configure at the far right. In the dialog's Advanced tab ensure Collect data from ASP.NET applications running on Internet Information Services is checked.

Configure the Test Plan
Either use an existing test plan or create a new one and in Testing Center > Plan > Contents add a new suite called Instructor. Create a new Test Case in Instructor called Can Navigate and then add the following steps:
- Launch IE
- Type URL and hit enter
- Click on Instructors
Now from Testing Center > Test > Run Tests run the Can Navigate test:

The aim of running the test this first time is to record each step so the whole test can be replayed on future runs. This sort of automation isn't to be confused with deep automation using tools such as Selenium or CodedUI, and is instead more akin to recording macros in Microsoft Office applications. Nevertheless, the technique is very powerful due to the repeatability it offers and is also a big time saver. The process of recording the steps is a little fiddly and I recommend you follow the MSDN documentation here. The main point to remember is to mark each step as passed after successful completion so that MTM correctly associates the action with the step. Hopefully the build steps are obvious, the aim being simply to display the list of instructors.
The final configuration step for the test plan is to configure Run Settings from Testing Center > Plan:
- Manual runs > Test settings = Manual Test Run (created above)
- Manual runs > Test environment = ALMWEB01 (created above, your environment name may differ)
- Builds > Filter for builds = ContosoUniversity_Main_Nightly (Ready for Deployment) (or whatever build you are using)
- Builds > Build in use = Latest build you have marked with the Build Quality of Ready for Deployment. (Build quality is arbitrary -- just needs to be consistent.)

Web Server Configuration
In order for TIA data to be collected on the web server there are several configuration steps to be completed:
- When environments are created by MTM Lab Center they are configured to use the Network Service account. We need to use the dedicated ALM\TFSTEST domain account (or whatever you have called yours) so on the web server run the Test Agent Configuration Tool and make the change. Additionally the TFSTEST account needs to be in the Local Administrators group on the web server.
- The domain account (ALM\CU-DQA) that is used as the identity for the application pool (CU-DQA) for the DQA website needs to have a local profile. You can either log on to the server as ALM\CU-DQA or use the runas /user:domain\name /profile cmd.exe command, supplying the appropriate credentials.
- The CU-DQA application pool needs to have the Load User Profile property set to True.
Web Client Configuration
The web client machine (I'm using Windows 8.1) needs to be running MTM and also has to have the Microsoft Test Agent installed. This should be configured with the ALM\TFSTEST account (which should be in the Local Administrators group) and be registered to the test controller.
Putting it All Together
With the configuration out of the way it's now time to generate TIA data. The Can Navigate test needs one successful run on the web client against the currently selected build in order to generate a baseline. As noted above it seems that TIA doesn't play nicely with multiple application pools and I found I needed to stop the CU-DAT and CU-PRD application pools before running the test.
- In MTM navigate to Testing Center > Test > Run Tests and run Can Navigate as earlier.
- The Test Runner will fire up and you should click Start Test.
- The Test Runner will display the steps of the test and the VCR style controls. From the Play dropdown choose Play all:

- When the test has successfully completed use the Mark test case result dropdown to mark the test as a Pass:

- A dialog will pop up advising that impact data is being collected and when it closes you should Save and Close the test.
Back at Testing Center > Test > Run Tests, in order to check that TIA data was generated click on View results with Can Navigate selected. In the attachments section you should see a file ending in testimpact.xml:

We now need to create a change to the method that displays the list of instructors. Typically this change will arise as part of fixing a bug however it will be sufficient here to fake the change in order to get TIA to work. To achieve this open up the Contoso University demo app and navigate to ContosoUniversity.Web > Controllers > InstructorController > Index. Make any non-breaking change -- I changed the OrderBy of the query that returns the instructors.
Check the code in to version control and then start a new build. If the build is successful you can confirm that Can Navigate is now flagged as an impacted test. Firstly you should see this in the build report either from Visual Studio or Team Web Access:

(Whilst you are examining the build report mark the Build Quality as Ready for Deployment, but note that you would typically do this after confirming a successful DAT stage). Secondly, in MTM navigate to Testing Center > Track > Recommended Tests. Change the Build in use to the build that has just passed and then change Previous build to compare to the build that was in use at the time of creating the baseline. A dialog should pop up advising that there may be tests that need to be re-run. After dismissing the dialog Can Navigate should be listed under Recommended tests:

Test Case Closed
As is often the case with continuous delivery pipeline work it seems like there is a great deal of configuration required to get a feature working and TIA is no exception. One valuable lesson is that whilst a multi-tenant web application configuration certainly saves on the number of VMs required for a demo environment it does cause problems and should almost certainly be avoided for an on-premises installation. I'll definitely be using separate web servers when I refresh my demo setup for TFS 2015. And when Windows Nano Server becomes available we won't be thinking twice about trying to save on the number of running VMs. Exciting times ahead...
Cheers -- Graham
Continuous Delivery with TFS: Configure Application Insights
If you get to the stage where you are deploying your application on a very frequent basis and you are relying on automated tests for the bulk of your quality assurance then a mechanism to alert you when things go wrong becomes crucial. You should have something in place anyway of course but in practice I suspect that application monitoring is either frequently overlooked or remains stubbornly on the to-do list.
A successful continuous delivery pipeline implementation shouldn't rely on the telephone or email as the alerting system and in this post in my blog series on implementing continuous delivery with TFS we look at how to integrate relevant parts of Microsoft's Application Insights (AI) tooling in to the pipeline. If you need to get up to speed with its capabilities I have a Getting Started blog post here. As a quick refresher AI is a suite of components that integrate with your application and servers and which sends telemetry to the Azure Portal. As a bonus, not only do you get details of diagnostic issues but also rich analytics on how you application is being used.
Big Picture
AI isn't just one component and in fact there are at least three main ways in which AI can be configured to provide diagnostic and analytic information:
- Adding the Application Insights SDK to your application.
- Installing Status Monitor on an IIS server.
- Creating Web Tests that monitor the availability of an HTTP endpoint available on the public Internet.
One key point to appreciate with AI and continuous delivery pipelines is that unless you do something about it AI will put the data it collects from the different stages of your pipeline in one ‘bucket' and you won't easily be able to differentiate what came from where. Happily there is a way to address this as we'll see below. Before starting to configure AI there are some common preparatory steps that need to be addressed so let's start with those.
Groundwork
If you have been following along with this series of blog posts you will be aware that so far we have only created DAT and DQA stages of the pipeline. Although not strictly necessary I created a PRD stage of the pipeline to represent production: if nothing else it's handy for demonstrations where your audience may expect to see the pipeline endpoint. I won't detail all the configuration steps here as they are all covered by previous blog posts however the whole exercise only took a few minutes. As things stand none of these stages exposes our sample web application to the public Internet however this is necessary for the creation of Web Tests. We can fix this in the Azure portal by adding an HTTP endpoint to the VM that runs IIS:

Our sample application is now available using a URL that begins with the cloud service name and includes the website name, for example http://mycloudservice.cloudapp.net/mywebapp. Be aware that this technique probably falls foul of all manner of security best practices however given that my VMs are only on for a few hours each week and it's a pure demo environment it's one I'm happy to live with.
The second item of groundwork is to create the containers that will hold the AI data for each stage of the pipeline. You will need to use the new Azure portal for this at https://portal.azure.com. First of all a disclaimer. There are several techniques at our disposal for segregating AI data as discussed in this blog post by Victor Mushkatin, and the comments of this post are worth reading as well since there are some strong opinions. I tried the tagging method but couldn't get it to work properly and as Victor says in the post this feature is at the early stages of development. In his post Victor creates a new Azure Resource for each pipeline stage however that seemed overly complicated for a demo environment. Instead I opted to create multiple Application Insights Resources in one Azure Resource group. As an aside, resource groups are fairly new to Azure and for any new Azure deployment they should be carefully considered as part of the planning process. For existing deployments you will find that your cloud service is listed as a resource group (containing your VMs) and I chose to use this as the group to contain the Application Insights Resources. Creating new AI resources is very straightforward. Start with the New button and then choose Developer Services > Application Insights. You'll need to provide a name and then use the arrow selectors to choose Application Type and Resource Group:

I created the following resource groups which represent the stages of my pipeline: CU-DEV, CU-DAT, CU-DQA and CU-PRD. What differentiates these groups is their instrumentation keys (often abbreviated to ikey). You'll need to retrieve the ikeys for each group and the way to do that in the new portal is via Browse > Filter By > Application Insights > $ResourceGroup$ > Settings > Properties where you will see the Instrumentation Key selector.
Add the Application Insights SDK to ContosoUniversity
We can now turn our attention to adding the Application Insights SDK to our Contoso University web application:
- Right-click your web project (ContosoUniversity.Web) within your Visual Studio solution and choose Add Application Insights Telemetry.

- The Add Application Insights to Project dialog opens and invites you to sign in to Azure:

- The first few times I tried to connect to Azure I got errors about not being able to find an endpoint but persistence paid off. I eventually arrived at a dialog that allowed me to choose my MSDN subscription via the Use different account link:

- Having already created my AI resources I used Configure settings to choose the CU-DEV resource:

- Back in the Add Application Insights to Project dialog click on the Add Application Insights to Project link to have Visual Studio perform all the necessary configuration.
At this stage we can run the application and click around to generate telemetry. If you are in Debug mode you can see this in the Output window. After a minute or two you should also see the telemetry start to appear in the Azure portal (Browse > Filter By > Application Insights > CU-DEV).
Configure AI in Contoso University for Pipeline Stages
As things stand deploying Contoso University to other stages of the pipeline will cause telemetry for that stage to be added to the CU-DEV AI resource group. To remedy this carry out the following steps:
- Add an iKey attribute to the appSettings section of Web.config:
|
|
<appSettings> <!-- Other settings here --> <add key="iKey" value="8fc11978-dd5b-7b87-addc-965329534108"/> </appSettings> |
- Add a transform to Web.Release.config that consists of a token (__IKEY__) that can be used by Release Management:
|
|
<appSettings> <add key="iKey" value="__IKEY__" xdt:Transform="SetAttributes" xdt:Locator="Match(key)"/> </appSettings> |
- Add the following code to Application_Start in Global.asax.cs:
|
|
Microsoft.ApplicationInsights.Extensibility.TelemetryConfiguration.Active.InstrumentationKey = System.Web.Configuration.WebConfigurationManager.AppSettings["iKey"]; |
- As part of the AI installation Views.Shared._Layout.cshtml is altered with some JavaScript that adds the iKey to each page. This isn't dynamic and the JavaScript instrumentationKey line needs altering to make it dynamic as follows:
|
|
instrumentationKey: "@Microsoft.ApplicationInsights.Extensibility.TelemetryConfiguration.Active.InstrumentationKey" |
- Remove or comment out the InstrumentationKey section in ApplicationInsights.config.
- In the Release Management client at Configure Apps > Components edit the ContosoUniversity\Deploy Web Site component by adding an IKEY variable to Configuration Variables.
- Still in the Release Management client open the Contoso University\DAT>DQA>PRD release template from Configure Apps > Agent-based Release Templates and edit each stage supplying the iKey value for that stage (see above for how to get this) to the newly added IKEY configuration variable.
After completing these steps you should be able to deploy your application to each stage of the pipeline and see that the Web.config of each stage has the correct iKey. Spinning up the website for that stage and clicking around in it should cause telemetry to be sent to the respective AI resource.
Install Status Monitor on the IIS server
The procedure is quite straightforward as follows:
- On your IIS server (ALMWEB01 if you are following the blog series) download and run the Status Monitor installation package from here.
- With the installation complete you'll need to sign in to your Microsoft Account after which you'll be presented with a configuration panel where the CU-DAT, CU-DQA and CU-PRD websites should have been discovered. The control panel lets you specify a separate AI resource for each website after which you'll need to restart IIS:

- In order to ensure that the domain accounts that the websites are running under have sufficient permissions to collect data make sure that they have been added to the Performance Monitor Users Windows local group.
With this configuration complete you should click around in the websites to confirm that telemetry is being sent to the Azure portal.
Creating Web Tests to monitor HTTP Availability
The configuration for Web Tests takes place in the new Azure portal at https://portal.azure.com. There are two types of test -- URL ping and a more involved Multi-step test. I'm just describing the former here as follows:
- In the new portal navigate to the AI resource you want to create tests for and choose the Availability tile:

- This opens the Web Tests pane where you choose Add web test:

- In the Create test pane supply a name and a URL and then use the arrow on Test Locations to choose locations to test from:

After clicking Create you should start to see data being generated within a few seconds.
In Conclusion
AI is clearly a very sophisticated solution for providing rich telemetry about your application and the web server hosting and I'm exited about the possibilities it offers. I did encounter a few hurdles in getting it to work though. Initial connection to the Azure portal when trying to integrate the SDK with Contoso University was the first problem and this caused quite a bit of messing around as each failed installation had to be undone. I then found that with AI added to Contoso University the build on my TFS server failed every time. I'm using automatic package restore and I could clearly see what's happening: every AI NuGet package was being restored correctly with the exception of Microsoft.ApplicationInsights and this was quite rightly causing the build to fail. Locally on my development machine the package restore worked flawlessly. The answer turned out to be an outdated nuget.exe on my build server. The fix is to open an Administrative command prompt at C:\Program Files\Microsoft Team Foundation Server 12.0\Tools and run nuget.exe update -self. Instant fix! This isn't AI's fault of course, although it is a mystery why one of the AI NuGets brought this problem to light.
Cheers -- Graham
Continuous Delivery with VSO: Executing Automated Web Tests with Microsoft Test Manager
In this fourth post in my series on continuous delivery with VSO we take a look at executing automated web tests with Microsoft Test Manager. There are quite a few moving parts involved in getting all this working so it's worth me explaining the overall aim before diving in with the specifics.
Overview
The tests we want to run are automated web tests written using the Selenium framework. I first wrote these tests for my Continuous Delivery with TFS blog posts series and you can read about how to create the tests here and how run run them using MTM and TFS here. The goal in this post is to run these tests using MTM and VSO, triggered as part of the DAT stage of the pipeline from RM. The tests are run from a client workstation that is configured with MTM (a requirement at the time of writing) and the Microsoft Test Agent. I've used Selenium's Firefox driver in the test code so Firefox is also required on the client machine.
In terms of what actually happens, firstly RM copies the complete build over to the client workstation and then executes a PowerShell script that runs TCM.exe which is a command-line utility that lets you run tests that are part of a test plan. Precisely what happens next is under the bonnet stuff but it's along the lines of the test controller is informed that there is work to be done and that in turn informs the test agent on the client machine that it needs to run tests. The test agent knows from the test plan which tests to run and in which DLL they live and has access to the DLLs in the local copy of the build folder. Each test first starts Firefox and then connects to the web server running the deployed Contoso University and performs the automation specified in the test.
In many ways the process of getting all this to work with VSO rather than TFS is very similar and because of that I don't go in to every detail in this post and instead refer back to my TFS blog post.
Configure a Test Controller
VSO doesn't offer a test controller facility so you'll need to configure this yourself. If you have a test controller already in use then it's simplicity itself to repurpose it to point to your VSO account using the Browse button. If you are starting from scratch see here for the details but obviously ensure you connect to VSO rather than TFS. One other difference is that in order to get past some permissions problems I found it necessary to specify credentials for the lab service account -- I used the same as the service logon account.
Although I started off by repurposing an existing controller, because of permissions problems I ended up creating a dedicated build and test server as I wanted to start with a clean sheet. One thing I found was that the Visual Studio Test Controller service wouldn't automatically start after booting the OS from the Stopped (deallocated) state. The application error log was clearly reporting that the test controller wasn't able to connect to VSO. Manually starting the service was fine so presumably there was some sort of timing issue with other OS components not being ready.
Configure Microsoft Test Manager
If MTM isn't already installed on your development workstation then that's the first step. The second step is to connect MTM to your VSO account. I already had MTM installed and when I went to connect it to VSO the website was already listed. If that's not the case you can use the Add server link from the Connect to Your Team Project dialog. Navigating down to your Team Project (ContosoUniversity) enables the Connect now link which then takes you to a screen that allows you to choose between Testing Center and Lab Center. Choose the latter and then configure Lab Center as per the instructions here.
Continue following these instructions to configure Testing Centre with a new test plan and test cases. Note that you need to have the Contoso University solution open in order to associate the actual tests with the test cases. You'll also need to ensure that when deployed the tests navigate to the correct URL. In the Contoso University demo application this is hard-coded and you need to make the change in Driver.cs located in the ContosoUniversity.Web.SeFramework project.
Configure a Web Client Test Machine
The client test machine needs to be created in the cloud service that was created for DAT and joined to the domain if you are using one. The required configuration is very similar to that required for TFS as described here with the exception that the Release Management Deployment Agent isn't required and nor is the RMDEPLOYER account. Getting permissions correctly configured on this machine proved critical and I eventually realised that the Windows account that the tests will run under needs to be configured so that MTM can successfully connect to VSO with the appropriate credentials. To be clear, these are not the test account credentials themselves but rather the normal credentials you use to connect to VSO. To configure all this, once the test account has been added to the Local Administrators group and MTM has been installed and the licence key applied you will need to log on to Windows as the test account and start MTM. Connect to VSO and supply your VSO credentials in the same way as you did for your development workstation and and verify that you can navigate down to the Contoso University team project and open the test plan that was created in the previous section.
Initially I also battled with getting the test agent to register correctly with the test controller. I eventually uninstalled the test agent (which I had installed manually) and let the test controller perform the install followed by the configuration. Whether that was the real solution to the problem I don't know but it got things working for me.
Executing TCM.exe with PowerShell
As mentioned above the code that starts the tests is a PowerShell script that executes TCM.exe. As a starting point I used the script that Microsoft developed for agent-based release templates but had to modify it to make it work with RM-VSO. In particular changes were made to accommodate the way variables are passed in to the script (some implicit such as $TfsUrl or $TeamProject and some explicit such as $PlanId or $SuiteId) and to remove the optional build definition and build number parameters which are not available to the vNext pipeline and caused errors when specified on the TCM.exe command line. The modified script (TcmExecvNext.ps1) and the original Microsoft script for comparison (TcmExec.ps1) are available in a zip here and TcmExecvNext.ps1 should be copied to the Deploy folder in your source control root. One point to note is that for agent-based pipelines to TFS Collection URL is passed as $TfsUrlWithCollection however in vNext pipelines it is passed in as $TfsUrl.
Configure Release Management
Because we are using RM-VSO this part of the configuration is completely different from the instructions for RM-TFS. However before starting any new configuration you'll need to make a change to the component we created in the previous post. This is because TCM.exe doesn't seem to like accepting the name of a build folder if it has a space in it. Some more fiddling with PowerShell might have found a solution but I eventailly changed the component's name from Drop Folder to DropFolder. Note that you'll need to visit the existing action and reselect the newly named component. Another issue which cropped-up is that TCM.exe choked when the build directory parameter was supplied with a local file path. The answer was to create a share at C:\Windows\DtlDownloads\DropFolder and configure with appropriate permissions.
The new configuration procedure for RM-VSO is as follows:
- From Configure Paths > Environments link the web client test machine to the DAT environment.
- From Configure Apps > vNext Release Templates open Contoso University\DAT>DQA.
- From the Toolbox drag a Deploy Using PS/DSC action to the deployment sequence to follow Deploy Web and Database and rename the action Run Automated Web Tests.
- Open up the properties of Run Automated Web Tests and set the Configuration Variables as follows:
- ServerName = choose the name of the web client test machine from the dropdown.
- UserName = this is the test domain account (ALM\TFSTEST in my case) that was configured for the web client test machine.
- Password = password for the UserName
- ComponentName = choose DropFolder from the dropdown.
- PSScriptPath = Deploy\TcmExecvNext.ps1
- SkipCaCheck = true
- Still in the properties of Run Automated Web Tests and set the Custom configuration as follows:
- PlanId = 8 (or whatever your Plan ID is as it is likely to be different)
- SuiteId = 10 (or whatever your Suite ID is as it is likely to be different)
- ConfigId = 1 (or whatever your Configuration ID is as it is likely to be different)
- BuildDirectory = \\almclientwin81b\DtlDownloads\DropFolder (your machine name may be different)
- TestEnvironment = ALMCLIENTWIN81B (yours may be different)
- Title = Automated Web Tests
Bearing in mind that the Deploy Using PS/DSC action doesn't allow itself to be resized to show all configuration values the result should look something like this:

Start a Build
From Visual Studio manually queue a new build from your build definition. If everything is in place the build should succeed and you can open Microsoft Test Manager to check the results. Navigate to Testing Center > Test > Analyze Test Runs. You should see your test run listed and double-clicking it will hopefully show the happy sight of passing tests:

Testing Times
As I noted in the TFS version of this post there are a lot of moving parts to get configured and working in order to be able to trigger tests to run from RM. Making all this work with VSO took many hours working through all the details and battling with permissions problems and myriad other things that didn't work in the way I was expecting them to. With luck I've hopefully captured all the details you need to try this in your own environment. If you do encounter difficulties please post in the comments and I'll do what I can to help.
Cheers -- Graham
Continuous Delivery with VSO: Application Deployment with Release Management
In the previous post in my blog series on implementing continuous delivery with VSO we got as far as configuring Release Management with a release path. In this post we cover the application deployment stage where we'll create the items to actually deploy the Contoso University application. In order to achieve this we'll need to create a component which will orchestrate copying the build to a temporary location on target nodes and then we'll need to create PowerShell scripts to actually install the web files to their proper place on disk and run the DACPAC to deploy any database changes. Note that although RM supports PowerShell DSC I'm not using it here and instead I'm using plain PowerShell. Why is that? It's because for what we're doing here -- just deploying components -- it feels like an unnecessary complication. Just because you can doesn't mean you should...
Sort out Build
The first thing you are going to want to sort out is build. VSO comes with 60 minutes of bundled build which disappears in no time. You can pay for more by linking your VSO account to an Azure subscription that has billing activated or the alternative is to use your own build server. This second option turns out to be ridiculously easy and Anthony Borton has a great post on how to do this starting from scratch here. However if you already have a build server configured it's a moment's work to reconfigure it for VSO. From Team Foundation Server Administration Console choose the Build Configuration node and select the Properties of the build controller. Stop the service and then use the familiar dialogs to connect to your VSO URL. Configure a new controller and agent and that's it!
Deploying PowerShell Scripts
The next piece of the jigsaw is how to get the PowerShell scripts you will write to the nodes where they should run. Several possibilities present themselves amongst which is embedding the scripts in your Visual Studio projects. From a reusability perspective this doesn't feel quite right somehow and instead I've adopted and reproduced the technique described by Colin Dembovsky here with his kind permission. You can implement this as follows:
- Create folders called Build and Deploy in the root of your version control for ContosoUniversity and check them in.
- Create a PowerShell script in the Build folder called CopyDeployFiles.ps1 in and add the following code:
1 2 3 4 5 6 7 8 9 10 11 12 13 14 15 16 17 18 19 20 |
Param( [string]$srcPath = $env:TF_BUILD_SOURCESDIRECTORY, [string]$binPath = $env:TF_BUILD_BINARIESDIRECTORY, [string]$pathToCopy ) try { $sourcePath = "$srcPath\$pathToCopy" $targetPath = "$binPath\$pathToCopy" if (-not(Test-Path($targetPath))) { mkdir $targetPath } xcopy /y /e $sourcePath $targetPath Write-Host "Done!" } catch { Write-Host $_ exit 1 } |
- Check CopyDeployFiles.ps1 in to source control.
- Modify the process template of the build definition created in a previous post as follows:
2.Build > 5. Advanced > Post-build script arguments = -pathToCopy Deploy
2.Build > 5. Advanced > Post-build script path = Build/CopyDeployFiles.ps1
To explain, Post-build script path specifies that CopyDeployFiles.ps1 created above should be run and Post-build script arguments feeds in the -pathToCopy argument which is the Deploy folder we created above. The net effect of all this is that the Deploy folder and any contents gets created as part of the build.
Create a Component
In a multi-server world we'd create a component in RM from Configure Apps > Components for each server that we need to deploy to since a component is involved in ensuring that the build is copied to the target node. Each component would then be associated with an appropriately named PowerShell script to do the actual work of installing/copying/running tests or whatever is needed for that node. Because we are hosting IIS and SQL Server on the same machine we only actually need one component. We're getting ahead of ourselves a little but a side effect of this is that we will use only one PowerShell script for several tasks which is a bit ugly. (Okay, we could use two components but that would mean two build copy operations which feels equally ugly.)
With that noted create a component called Drop Folder and add a backslash (\) to Source > Builds with application > Path to package. The net effect of this when the deployment has taken place is the existence a folder called Drop Folder on the target node with the contents of the original drop folder copied over to the remote folder. As long as we don't need to create configuration variables for the component it can be reused in this basic form. It probably needs a better name though.
Create a vNext Release Template
Navigate to Configure Apps > vNext Release Templates and create a new template called Contoso University\DAT>DQA based on the Contoso University\DAT>DQA release path. You'll need to specify the build definition and check Can Trigger a Release from a Build. We now need to create the workflow on the DAT design surface as follows:
- Right-click the Components node of the Toolbox and Add the Drop Folder component.
- Expand the Actions node of the Toolbox and drag a Deploy Using PS/DSC action to the Deployment Sequence. Click the pen icon to rename to Deploy Web and Database.
- Double click the action and set the Configuration Variables as follows:
- ServerName = choose the appropriate server from the dropdown.
- UserName = the name of an account that has permissions on the target node. I'm using the RMDEPLOYER domain account that was set up for Deployment Agents to use in agent based deployments.
- Password = password for the UserName
- ComponentName = choose Drop Folder from the dropdown.
- SkipCaCheck = true
- The Actions do not display very well so a complete screenshot is not possible but it should look something like this (note SkipCaCheck isn't shown):

At this stage we can save the template and trigger a build. If everything is working you should be able to examine the target node and observe a folder called C:\Windows\DtlDownloads\Drop Folder that contains the build.
Deploy the Bits
With the build now existing on the target node the next step is to actually get the web files in place and deploy the database. We'll do this from one PowerShell script called WebAndDatabase.ps1 that you should create in the Deploy folder created above. Every time you edit this and want it to run do make sure you check it in to version control. To actually get it to run we need to edit the Deploy Web and Database action created above. The first step is to add Deploy\WebAndDatabase.ps1 as the parameter to the PSScriptPath configuration variable. We then need to add the following custom configuration variables by clicking on the green plus sign:
- destinationPath = C:\inetpub\wwwroot\CU-DAT
- websiteSourcePath = _PublishedWebsites\ContosoUniversity.Web
- dacpacName = ContosoUniversity.Database.dacpac
- databaseServer = ALMWEBDB01
- databaseName = CU-DAT
- loginOrUser = ALM\CU-DAT
The first section of the script will deploy the web files to C:\inetpub\wwwroot\CU-DAT on the target node, so create this folder if you haven't already. Obviously we could get PowerShell to do this but I'm keeping things simple. I'm using functions in WebAndDatabase.ps1 to keep things neat and tidy and to make debugging a bit easier if I want to only run one function.
The first function is as follows:
1 2 3 4 5 6 7 8 9 10 11 12 13 14 15 16 17 18 19 20 21 22 23 24 25 26 27 28 29 |
function copy_web_files { if ([string]::IsNullOrEmpty($destinationPath) -or [string]::IsNullOrEmpty($websiteSourcePath) -or [string]::IsNullOrEmpty($databaseServer) -or [string]::IsNullOrEmpty($databaseName)) { $(throw "A required parameter is missing.") } Write-Verbose "#####################################################################" -Verbose Write-Verbose "Executing Copy Web Files with the following parameters:" -Verbose Write-Verbose "Destination Path: $destinationPath" -Verbose Write-Verbose "Website Source Path: $websiteSourcePath" -Verbose Write-Verbose "Database Server: $databaseServer" -Verbose Write-Verbose "Database Name: $databaseName" -Verbose $sourcePath = "$ApplicationPath\$websiteSourcePath" Remove-Item "$destinationPath\*" -recurse Write-Verbose "Deleted contents of $destinationPath" -Verbose xcopy /y /e $sourcePath $destinationPath Write-Verbose "Copied $sourcePath to $destinationPath" -Verbose $webDotConfig = "$destinationPath\Web.config" (Get-Content $webDotConfig) | Foreach-Object { $_ -replace '__DATA_SOURCE__', $databaseServer ` -replace '__INITIAL_CATALOG__', $databaseName } | Set-Content $webDotConfig Write-Verbose "Tokens in $webDotConfig were replaced" -Verbose } copy_web_files |
The code clears out the current set of web files and then copies the new set over. The tokens in Web.config get changed in the copied set so the originals can be used for the DQA stage. Note how I'm using Write-Verbose statements with the -Verbose switch at the end. This causes the RM Deployment Log grid to display a View Log link in the Command Output column. Very handy for debugging purposes.
The second function deploys the DACPAC:
|
|
function deploy_dacpac { if ([string]::IsNullOrEmpty($dacpacName) -or [string]::IsNullOrEmpty($databaseServer) -or [string]::IsNullOrEmpty($databaseName)) { $(throw "A required parameter is missing.") } Write-Verbose "#####################################################################" -Verbose Write-Verbose "Executing Deploy DACPAC with the following parameters:" -Verbose Write-Verbose "DACPAC Name: $dacpacName" -Verbose Write-Verbose "Database Server: $databaseServer" -Verbose Write-Verbose "Database Name: $databaseName" -Verbose $cmd = "& 'C:\Program Files (x86)\Microsoft SQL Server\120\DAC\bin\sqlpackage.exe' /a:Publish /sf:'$ApplicationPath'\'$dacpacName' /tcs:'server=$databaseServer; initial catalog=$databaseName'" Invoke-Expression $cmd | Write-Verbose -Verbose } deploy_dacpac |
The code is simply building the command to run sqlpackage.exe -- pretty straightforward. Note that the script is hardcoded to SQL Server 2014 -- more on that below.
The final function deals with the Create login and database user.sql script that lives in the Scripts folder of the ContosoUniversity.Database project. This script ensures that the necessary SQL Server login and database user exists and is tokenised so it can be used in different stages -- see this article for all the details.
1 2 3 4 5 6 7 8 9 10 11 12 13 14 15 16 17 18 19 20 21 22 23 24 25 |
function run_create_login_and_database_user { if ([string]::IsNullOrEmpty($loginOrUser) -or [string]::IsNullOrEmpty($databaseName)) { $(throw "A required parameter is missing.") } Write-Verbose "#####################################################################" -Verbose Write-Verbose "Executing Run Create Login and Database User with the following parameters:" -Verbose Write-Verbose "Login or User: $loginOrUser" -Verbose Write-Verbose "Database Server: $databaseServer" -Verbose Write-Verbose "Database Name: $databaseName" -Verbose $scriptName = "$ApplicationPath\Scripts\Create login and database user.sql" (Get-Content $scriptName) | Foreach-Object { $_ -replace '__LOGIN_OR_USER__', $loginOrUser ` -replace '__DB_NAME__', $databaseName } | Set-Content $scriptName Write-Verbose "Tokens in $scriptName were replaced" -Verbose $cmd = "& 'sqlcmd' /S $databaseServer /i '$scriptName' " Invoke-Expression $cmd | Write-Verbose -Verbose Write-Verbose "$scriptName was executed against $databaseServer" -Verbose } run_create_login_and_database_user |
The tokens in the SQL script are first swapped for passed-in values and then the code builds a command to run the script. Again, pretty straightforward.
Loose Ends
At this stage you should be able to trigger a build and have all of the components deploy. In order to fully test that everything is working you'll want to create and configure a web application in IIS -- this article has the details.
To create the stated aim of an initial pipeline with both a DAT and DQA stage the final step is to actually configure all of the above for DQA. It's essentially a repeat of DAT so I'm not going to describe it here but do note that you can copy and paste the Deployment Sequence:

One remaining aspect to cover is the subject of script reusability. With RM-TFS there is an out-of-the-box way to achieve reusability with tools and actions. This isn't available in RM-VSO and instead potential reusability comes via storing scripts outside of the Visual Studio solution. This needs some thought though since the all-in-one script used above (by necessity) only has limited reusability and in a non-demo environment you would want to consider splitting the script and co-ordinating everything from a master script. Some of this would happen anyway if the web and database servers were distinct machines but there is probably more that should be done. For example, tokens that are to be swapped-out are hard-coded in the script above which limits reusability. I've left it like that for readability but this certainly feels like the sort of thing that should be improved upon. In a similar vein the path to sqlpackage.exe is hard coded and thus tied to a specific version of SQL Server and probably needs addressing.
In the next post we'll look at executing automated web tests. Meantime if you have any thoughts on great ways to use PowerShell with RM-VSO please do share in the comments.
Cheers -- Graham
Continuous Delivery with VSO: Configuring Release Management
In this post in my blog series on continuous delivery with VSO we look at configuring Release Management for Visual Studio. RM is part of the TFS ecosystem and is used to deploy our code to the different environments that constitute the delivery pipeline. It was originally built to work with TFS however the 2013.4 version released in November 2014 now works with VSO. Inevitably of course I'm going to be comparing how RM with VSO stacks up against RM with TFS.
Setting the Scene
From now on in this series of blog posts I'm going to assume that you are working in Azure and have a setup that resembles the one I created for my Continuous Delivery with TFS series of posts. If you are starting from scratch and need to catch up then these are the posts that can help:
One of the big advantages of RM-VSO is that there is no need to run a TFS instance. Additionally there is no need to run an RM server instance or Deployment Agents on target nodes since this is all taken care of, either behind the scenes in the case of the RM server or by using a different technique in the case of deploying to target nodes. Whilst the RM-VSO offering reduces the number of moving parts (which is good) it also imposes restrictions. As an example, RM-TFS allows us to reuse deployment VMs in different environments. In contrast RM-VSO doesn't allow this and consequently a multi-tenant model (eg one IIS machine hosting multiple websites) isn't possible, at least not without a substantial amount of jiggery-pokery. Does this matter? It depends... For a demo environment fewer VMs is preferable if you need to preserve your Azure credits, but in vivo you probably want separate VMs anyway. There is an easy -- if inelegant -- workaround for those that want to preserve Azure credits and I describe this below.
Configuring Azure to Work with RM
Our initial pipeline will consist of two environments: DAT (Development Automated Test) and DQA (Development Quality Assurance). Our Contoso University sample application has a web component and a database component so we'll need the services of IIS and SQL Server. With RM-TFS these can be dedicated web and database VMs that host multiple websites and databases but as mentioned above out of the box this isn't possible with RM-VSO. An additional requirement is a one-to-one mapping between RM-VSO environments and Azure cloud services. To work around all this we'll use VMs that host both IIS and SQL Server. A bit hacky for a demo setup but what to do? The procedure for setting all this up is as follows:
- In the Azure portal create two new cloud services to host VMs for each RM-VSO environment. I called mine datcloudservice.cloudapp.net and dqacloudservice.cloudapp.net -- you'll need to choose unique names for your services.
- Now create two new VMs -- one in each cloud service. I called mine ALMWEBDB01 and ALMWEBDB02. The good news is that despite being in different cloud services these servers can be in the same virtual network, affinity group and storage account. This keeps everything neat and tidy and also means the servers can be part of your domain if you have set one up.
- Both of these servers need to have IIS and SQL Server installed. This is fairly standard stuff so I won't be covering this here. One note of caution is that to preserve Azure credits be sure to install SQL Server from scratch rather than use an image from the gallery with SQL Server pre-installed as the latter technique is much more costly.
- These servers also need an account adding to the local administrators group that will be used in the deployment process. I used the RMDEPLOYER domain account that was set up for Deployment Agents to use in agent based deployments. In addition RMDEPLOYER will need a login for SQL Server and appropriate permissions. The easy path in a demo environment is to grant sysadmin but clearly that may be unwise in production.
The other VM which is core to all this is your developer workstation running Visual Studio, Release Management and Microsoft Test Manager. See above for the link to getting this machine configured if necessary.
Connect Release Management to VSO
I'm making the assumption here that you already have the RM client connected to TFS and want to connect it to VSO. If you have a new install of RM client the steps will be similar. You'll need to start an already configured RM client with your TFS instance up-an-running otherwise it just chokes. To switch over from TFS to VSO navigate to Administration > Settings > System Settings and click on the Edit link at the end of the Release management Server URL setting:

In the Configure Services dialog that appears add in the URL of your VSO account, ie https://myaccount.visualstudio.com. You'll probably be prompted to enter credentials after which you'll be prompted to allow the client to restart. When it does you have an instance of the client ‘re-branded' for VSO, by which I mean there are some changes to the user interface to reflect the difference between the features supported by TFS and VSO. One immediately obvious difference is that there is no place to specify SMTP settings as VSO handles all that.
Connect Release Management to Azure and Configure an Environment
One key difference between VSO and TFS is that VSO can only deploy to Azure VMs. In order to allow this you must configure RM with your Azure subscription:
- Download a text file containing your Azure subscription settings from here.
- From Administration > Manage Azure click on New and fill in the Name, Subscription ID and Management Certificate Key from the text file. Pay particular attention if you have more than one Azure subscription. For the Management Certificate Key you want everything between the quotes. Get the appropriate Storage Account Name from here. Consider deleting the Azure subscription settings file when you are finished with it for security purposes.
- Create DAT and DQC stages from Administration > Manage Pick Lists. See here for my TFS equivalent post.
- From Configure Paths > Environments click on New vNext: Azure to create a new environment and click Link Azure Environment to bring up the Azure Environments dialog. Select your Azure subscription and then use the Link button to link the DAT cloud service.
- With the environment created click on Link Azure Servers to link the VM hosted in the DAT cloud service:

- Note that you can't change the name of the environment -- it is fixed as the name of the cloud service.
- Now repeat the process for the DQA cloud service, after which you should have two environments:

Configure a vNext Release Path
With the environments created we can create a release path. Navigate to Configure Paths > vNext Release Paths and create a new path called Contoso University\DAT>DQA. Add two stages to it (one for DAT and another for DQA) and configure with the respective environments. You will need to add yourself or another user to the approvals workflow as the concept of groups isn't available in RM-VSO. Additionally the DAT workflow should be automated. You should end up with something similar to this:

Again there are differences between the VSO version and the TFS version, since for some reason the toggle email notification icons are missing from the VSO version. Other than that createing a release path with RM-VSO is very similar to RM-TFS.
Until Next Time
That's as far as we are going in this post. Next time we'll configure the actual release template and get to grips with using PowerShell scripts to deploy our components.
Cheers -- Graham
Continuous Delivery with VSO: Configuring the Basics
In this first post on my series on implementing continuous delivery with Visual Studio Online we look at configuring the basics, including setting up an account and linking in to Visual Studio. As usual I assume a degree of familiarity with the tooling and if you need to get up to speed with VSO I have a getting started post here. I also assume that you already have a Microsoft account and I'll be writing the series from the perspective of someone with an MSDN subscription who has access to Microsoft software and Azure credits. If that's not you then all is not lost since much of the tooling is available for free or as trial versions.
Create a VSO Account and Configure a Project
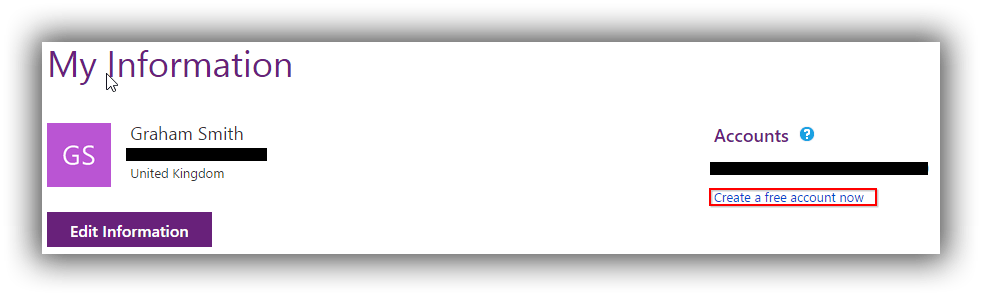
Our journey begins by creating a new VSO account. Head over to this page and sign in with your Microsoft account. Under the Accounts list there is a Create a free account now link which allows you to create a new account using a unique URL ending in visualstudio.com. A fairly recent addition is the ability to have the account hosted in West Europe by clicking Change options. Once created you should see your account listed with any other accounts that you have created or have been invited to join.
The first time you visit your account (analogous to a Team Project Collection in on-premise TFS) you will need to Create your first project which is analogous to a Team Project. I created a project called ContosoUniversity based on the Microsoft Visual Studio Scrum 2013.4 process template and using Team Foundation Version Control.
Link the VSO Account to Visual Studio 2013
Once your new project is created the next step is to hook it up to Visual Studio 2013. You can do this from the Overview page of your new project if you have the account open in a browser running on your development machine or you can do as I did and manually connect in Visual Studio via Team Explorer -- Connect. I added a new server using https://pleasereleaseme.visualstudio.com and that was all that was required for Visual Studio to prompt me for credentials.
With the account added the next step is to map a workspace. I'd previously mapped ContosoUniversity to the TFS version of the project and the filepath was already in use so I added a VSO folder before the project name to keep everything tidy and avoid a ContosoUniversity2 folder. Next up is to add the ContosoUniversity source code to version control under a Main folder that is configured as a branch -- see this post for fuller details. If you have your own version of ContosoUniversity from my TFS blog post series that you want to use then go ahead (see here for a utility to unbind the solution from version control prior to copying it over) or you can download a zip of the code from here. At this point you should be able to publish the database to LocalDb and run the application.
Create and Run a Build
As a final step to getting the basics configured we'll create and run a build. Although there is a Build area within VSO you can't actually create a build here, and you need to do that from within Visual Studio. From Team Explorer choose Builds and then New Build Definition. The process is very similar to the one for the full-blown TFS I describe here. The main differences are that in Build Defaults I left Staging Location set to Copy build output to server and in Process I chose the TfvcTemplate.12.xaml build process template and in Automated Tests I changed test to unittests to stop the automated web tests from running. I also set 5. Advanced > MSBuild arguments to /p:UseWPP_CopyWebApplication=true /p:PipelineDependsOnBuild=false to ensure that the web.config transform that gives the tokenised version takes place.
With the build running successfully I did notice one immediate different compared with TFS: it can take substantially longer for the build to wait in the queue. I can't find a reference but I'm pretty sure I've read or heard that a build from cold is going to be longer because VSO has to stand up the infrastructure for your build. I've also found that the first build from cold fails with missing assembly reference errors -- presumably package download not working. Inexplicably subsequent builds work fine. I still need to verify this with more testing but if you're finding this do let me know via the comments. On the plus side once your build is created you can queue it from the build section of VSO:

To finish off, the initial impression of VSO is that it's very slick and extremely well integrated with Visual Studio. It's certainly orders of magnitude easier to set up than TFS. Does it have all the flexibility of TFS when it comes to continuous delivery? We'll start to find out over the next few posts.
Cheers -- Graham
Continuous Delivery with TFS: Behind the Scenes of the RM Deployment Agent
As with many aspects of technology understanding how something works behind the scenes can be a real boon when it comes to troubleshooting. In this post in my blog series on implementing continuous delivery with TFS we take a look at the Release Management for Visual Studio Deployment Agent, and specifically how it does its thing. Bear in mind that I don't have any inside knowledge about the Deployment Agent and this post is just based on my own experience and observations.
Basic Hook-Up
The first step in eliminating easy errors with the Deployment Agent is to ensure that it is installed correctly and can communicate with the RM Server. The key question is whether your servers are part of a domain. If they are then the easiest way to configure RM is to create a domain account (RMDEPLOYER for example) and add this to the Manage Users section of the RM Client as a Service User. On target nodes add this domain account to the Administrators group and then install the Deployment Agent specifying the domain RMDEPLOYER as the service account. See this post for a bit more detail. If your servers are not part of a domain you will need to use shadow accounts which are simply local accounts that all have the same name and password. The only difference is that you add the different shadow accounts of the different nodes to the Manage Users section of the RM Client as a Service User -- make sure you use the machine name as well as the account name ie the Windows Account field should be $MyNodeName$\RMDEPLOYER.
The test that all is working is to see the servers listed as Ready in the RM Client under Configure Paths > Servers. Something I have observed in my demo environment is that when deployment nodes boot up before my all-in-one TFS machine they don't seem to communicate. When that happens I use a PowerShell script to remotely restart the service (eg Start-AzureVM -ServiceName $cloudservicename -Name $SERVERNAME).
In a production environment your circumstances could be wildly different from a clean demo setup. I can't cover all the scenarios here but if you are experiencing problems and you have a complicated environment then this post could be a good troubleshooting starting point.
Package Deployment Mechanism
When the agent is installed and running it polls the RM server for packages to deploy on a schedule that can be set in the RM client under Administration > Settings > Deployer Settings > Look for packages to deploy every. On my installation it was set at 28 seconds but if time is critical you may want to shorten that.
When the agent detects that it has a package to deploy or actions to perform it copies the necessary components over to C:\Users\RMDEPLOYER\AppData\Local\Temp\RM\T\RM (where RMDEPLOYER is the name of the account the Deployment Agent is running under which might be different in your setup). There are at least two types of folder that get created:
- Deployer Tools. This contains any tools and their dependencies that are needed to perform tasks. These could be executables, PowerShell scripts and so on. They are organised in a folder structure that relates to their Id and version number in the RM server database. For example in my database XCopy Deployer (irxcopy.cmd) has Id = 12 Version = 2 in dbo.DeployerTool and is thus deployed to C:\Users\RMDEPLOYER\AppData\Local\Temp\RM\T\RM\DeployerTools\12\2.
- Action or Component. These folders correspond to the actions that will take place on that node. The names are the same as the names in the Release Management client Deployment Log (from Releases > Releases). A sub folder (whose name includes the date and time and other more mysterious numbers) contains the tool, the files it will deploy or otherwise work with and a file called IR_ProcessAutoOutput.log which is the one displayed when clicking the View Log link in the Deployment Log:

Component folders warrant a little bit more analysis. What exactly gets deployed to the timestamped sub-folder is dependant on how the component is configured under Configure Apps > Components, specifically the Build Drop Location. If this is configured simply with a backslash (\) then all of the drop folder is deployed. This can be further refined by specifying a specific folder, in which case the contents of that folder get deployed. For example the Contoso University\Deploy Web Site component specifies \_PublishedWebsites\ContosoUniversity.Web as the Build Drop Location folder which means that just the website files are deployed.
It's perhaps worth noting here that there are two mechanisms for the Deployment Agent to pull in files: UNC or HTTP(S). This is configured on a per-server basis in Configure Paths > Servers > Deployment Agent. UNC is much quicker than HTTP(S) but the latter method is the only choice if your node doesn't have access to the UNC path.
A final aspect to touch on is that over time the node would get choked with old deployments if no action were taken, and to guard against this the Deployment Agent runs a cleanup process on a schedule specified in Administration > Settings > Deployer Settings. This is something to look at if disk space is tight.
Debugging Package Deployment
Having described how package management works -- at least at a high level -- what are the troubleshooting options when a component is failing to deploy or run correctly? These are the logs that are available on a target node:
- IR_ProcessAutoOutput.log -- saved to the action or component folder as above.
- DeploymentAgent.log -- cumulative log saved to C:\Users\RMDEPLOYER\AppData\Local\Temp\Microsoft\ReleaseManagement\12.0\Logs.
- $GUID$DeploymentAgent.log -- instance log saved to C:\Users\RMDEPLOYER\AppData\Local\Temp\Microsoft\ReleaseManagement\12.0\Logs. Not sure of the value of these since I've never seen them contain anything.
If between them these logs don't provide sufficient information for troubleshooting your problem you can increase the level of detail -- this post has the details but don't forget to restart the Microsoft Deployment Agent service. Additionally, if you have SMTP set up and working you will also receive a Deployment Failed! notification email. This can be particularly useful because it invariably contains the command line that failed. This leads on to a useful debugging technique where you rerun the failing command yourself. For example if the command was running a PowerShell script simply open the PowerShell console, switch to the correct folder and paste in the command from the email. Chances are that you will get a much more informative error message this way.
Final Thoughts
I know from personal experience that debugging RM components can be a frustrating experience. Typically it's a daft mistake with a parameter or something similar but sorting this type of problem out can really eat time. Do you have any tips for debugging components? Are there other error logs that I haven't mentioned? Please do share your experiences and findings using the comments.
Cheers -- Graham
Continuous Delivery with TFS: Automatically Versioning Assemblies as Part of The Build
In a previous post in this series on implementing continuous delivery with TFS we looked at how some simple tweaks to the build process can help with the goal of baking quality in. This post continues in the vein of making improvements to the pipeline by addressing the issue of assembly versioning. What issue is that, I hear some of you asking? It's the situation where your Visual Studio solution contains many projects (maybe dozens) and you want all the projects to have same assembly versioning, ie the details you would traditionally set in AssemblyInfo.cs. A Google search will reveal several ways to accomplish this but most techniques involve some maintenance when a new project is added. In this post I explain how to make a publicly available low maintenance solution work with the Release Management build process template. I should point out that this issue won't affect everyone, and if you or your business don't care about this issue then do feel free to ignore. It is quite interesting though as it involves editing a build process template.
TFSVersioning on CodePlex
If assembly versioning is important to you and you use TFS there is a good chance you've seen the TFSVersioning solution available on CodePlex. It's a very nice piece of work that versions all of your solution's assemblies as part of the build process. If a new project is added it automatically gets included, so it's a low maintenance solution. There are essentially two ways to use TFSVersioning -- with the build process template that the project provides or with your own process template. This latter technique is a little involved as it requires editing your build template, but it's the technique we need to use here since we would like to use the ReleaseTfvcTemplate.12.xml build process template that ships with Release Management 2013.4. It turns out that editing this template is quite a job and I'm indebted to my good friend, colleague and TFS guru Bharath Sundaresan for figuring out all of the complicated details. An additional required hurdle is that the project hasn't been updated for TFS 2013 but fortunately it's not a lot of work to remedy this. The TFSVersioning deployment pack is available from the Downloads page and it has some great documentation which I recommend reading before you begin.
Update TFSVersioning for TFS2013
The core component that we need to update for TFS 2013 is TfsBuild.Versioning.Activities.dll. To accomplish this follow these steps:
- Download the latest source code for TFSVersioning from the Source Code page and unzip to somewhere convenient.
- Navigate to the latest version under Prod and open BuildVersioning.sln. Remove the TfsBuild.Versioning.Activities.Tests and TfsBuild.Versioning.Activities.Tests.Stubs projects as we don't need to amend them for what we are doing here.
- Expand the References node of the TfsBuild.Versioning.Activities project and notice that the Microsoft.TeamFoundation.* references are marked as missing:

- Remove these references and replace them with the 2013 versions from C:\Program Files (x86)\Microsoft Visual Studio 12.0\Common7\IDE\ReferenceAssemblies\v2.0.
- You shoud now be able to build a Release version of TfsBuild.Versioning.Activities.dll.
Once you have succesfully updated the project for TFS 2013 it's probably a good idea to make sure that a basic installation of TFSVersioning works. Follow these steps to verify this:
- Download and unzip the latest TFSVersioning deployment pack -- currently 2.0.1. Copy VersioningBuildTemplate20.xaml from the pack to the ContosoUniversity BuildProcessTemplates folder and check in to version control.
- Under ContosoUniversity create a new folder called CustomActivityStorage and copy over the new version of TfsBuild.Versioning.Activities.dll. Check in to version control.
- From Team Explorer in Visual Studio navigate to Builds > Actions > Manage Build Controllers.
- In Manage Build Controllers dialog choose Properties and in Manage Controller Properties set Version control path to custom assemblies to $/ContosoUniversity/CustomActivityStorage.

- Now create a test build definition, replacing the standard release template with VersioningBuildTemplate20.xaml and setting all required properties including the drop folder.
- Whilst editing the build definition set any properties under the Build Versioning and Build Versioning (Optional) sections as you wish. Refer to the documentation for TFSVersioning for details.
- Queue a manual build of the test build definition. Observe in the drops folder that the ContosoUniversity.* binaries all have the same File version.
Update the ReleaseTfvcTemplate.12 Release Template with the TFSVersioning Custom Activity
This process broadly follows the Harder Installation but More Instructive section of the TfsVersioning User and Development Guide however modifying ReleaseTfvcTemplate.12.xaml requires several more steps. Partly this is because TfsBuild.Versioning.Activities.dll contains more functionality that isn't referred to in the documentation and partly because ReleaseTfvcTemplate.12.xaml is missing some activities that (reading between the lines) were present in the template that was used by the TFSVersioning project. In the instructions below I assume a degree of familiarity with editing release templates. If you need guidance take a look here for just one example of how to get started. You should be aware that there are two ways to edit templates: through the XAML designer and through notepad. The former is less prone to error but slow and the latter is much faster but with the distinct possibility of a copy and paste error. The technique I describe below also sets you up for relatively easy debugging of the process template since there is a good chance of not getting everything right first time.
- Install the updated TfsBuild.Versioning.Activities.dll to the Global Assembly Cache by opening a Visual Studio command prompt (from C:\Program Files (x86)\Microsoft Visual Studio 12.0\Common7\Tools\Shortcuts if your shortcuts are missing in Windows 8.1) and issuing a command similar to gacutil -i "C:\Users\Graham\Downloads\tfsversioning-103318\Prod\V 2.0.1.0\Source\TfsBuild.Versioning.Activities\bin\Release\TfsBuild.Versioning.Activities.dll".
- Copy C:\Program Files (x86)\Microsoft Visual Studio 12.0\Release Management\Client\bin\ReleaseTfvcTemplate.12.xaml to the ContosoUniversity BuildProcessTemplates folder and check in to version control. Chances are you already have a template with the same name so you'll probably want to change the name to ReleaseTfvcTemplate.12.Versioning.xaml or similar. Once checked in open this template in Visual Studio so it displays in the XAML editor.
- Set up the Visual Studio Toolbox to work with TfsBuild.Versioning.Activities.dll in a custom tab. You can reference the version in CustomActivityStorage. Note that you only need to add the VersionAssemblyInfoFiles item.
- Drag the VersionAssemblyInfoFiles activity from the toolbox to the workflow as the first item under Compile, Test and Publish. Feel free to give the activity a custom name. If you examine the properties of the activity you will see all the InArguments that need to be married up with either Variables or Arguments that do not yet exist in the process template:

- The arguments can be created as per the TfsVersioning User and Development Guide instructions using the Arguments editor but a faster way is to open the template in Notepad, copy the following values and append them to the <x:Members> section.
1 2 3 4 5 6 7 8 9 10 11 12 13 14 15 16 17 18 |
<x:Property Name="AssemblyCompanyPattern" Type="InArgument(x:String)" /> <x:Property Name="AssemblyConfigurationPattern" Type="InArgument(x:String)" /> <x:Property Name="AssemblyCopyrightPattern" Type="InArgument(x:String)" /> <x:Property Name="AssemblyCulturePattern" Type="InArgument(x:String)" /> <x:Property Name="AssemblyDescriptionPattern" Type="InArgument(x:String)" /> <x:Property Name="AssemblyFileVersionPattern" Type="InArgument(x:String)" /> <x:Property Name="AssemblyInfoFilePattern" Type="InArgument(x:String)" /> <x:Property Name="AssemblyInformationalVersionPattern" Type="InArgument(x:String)" /> <x:Property Name="AssemblyProductPattern" Type="InArgument(x:String)" /> <x:Property Name="AssemblyTitlePattern" Type="InArgument(x:String)" /> <x:Property Name="AssemblyTrademarkPattern" Type="InArgument(x:String)" /> <x:Property Name="AssemblyVersionPattern" Type="InArgument(x:String)" /> <x:Property Name="BuildNumberPrefix" Type="InArgument(x:Int32)" /> <x:Property Name="BuildSettings" Type="InArgument(mtbwa:BuildSettings)" /> <x:Property Name="DoCheckinAssemblyInfoFiles" Type="InArgument(x:Boolean)" /> <x:Property Name="ForceCreateVersion" Type="InArgument(x:Boolean)" /> <x:Property Name="UseVersionSeedFile" Type="InArgument(x:Boolean)" /> <x:Property Name="VersionSeedFilePath" Type="InArgument(x:String)" /> |
- The next step is to add the metatdata items that allow each of the above arguments to be set. Again, it's possible to use the Metadata editor but the faster Notepad way is to copy the following values and append them to the <mtbw:ProcessParameterMetadataCollection> section.
1 2 3 4 5 6 7 8 9 10 11 12 13 14 15 16 17 |
<mtbw:ProcessParameterMetadata Category="Build Versioning" Description="This is the pattern used to replace the AssemblyFileVersion value." DisplayName="Assembly File Version Pattern" ParameterName="AssemblyFileVersionPattern" /> <mtbw:ProcessParameterMetadata Category="Build Versioning" Description="This is the pattern used to replace the AssemblyVersion value." DisplayName="Assembly Version Pattern" ParameterName="AssemblyVersionPattern" /> <mtbw:ProcessParameterMetadata Category="Build Versioning" Description="This is the pattern used to find the AssemblyInfo files. Generally, you shouldn't need to change this value." DisplayName="AssemblyInfo File Pattern" ParameterName="AssemblyInfoFilePattern" /> <mtbw:ProcessParameterMetadata Category="Build Versioning" Description="Indicated whether the AssemblyInfo files should be checked back into source control after they are modified." DisplayName="Perform Check-in of the AssemblyInfo Files" ParameterName="DoCheckinAssemblyInfoFiles" /> <mtbw:ProcessParameterMetadata Category="Build Versioning" Description="If true, the versioning process will create AssemblyVersion or AssemblyFileVersion values even if they do not already exist." DisplayName="Force Create Version" ParameterName="ForceCreateVersion" /> <mtbw:ProcessParameterMetadata Category="Build Versioning" Description="Indicate which values to use as the versioning patterns. If set to True, the "seedfile.xml" file must exist in the location described by the "Version Seed File Path" setting. Otherwise, the "Assembly Version Pattern" and "Assembly File Version Pattern" values will be used." DisplayName="Use Version Seed File" ParameterName="UseVersionSeedFile" /> <mtbw:ProcessParameterMetadata Category="Build Versioning" Description="Relative path location for the seed (xml) file containing the Assembly Version and Assembly File Version values." DisplayName="Version Seed File Path" ParameterName="VersionSeedFilePath" /> <mtbw:ProcessParameterMetadata Category="Build Versioning" Description="Number added to the version component that uses the "B" symbol pattern (Build Number). This helps create a unique version for a build definition." DisplayName="Build Number Prefix" ParameterName="BuildNumberPrefix" /> <mtbw:ProcessParameterMetadata Category="Build Versioning (Optional)" Description="Assembly Title Attribute: String value specifying a friendly name for the assembly. For example, an assembly named comdlg might have the title Microsoft Common Dialog Control." DisplayName="Assembly Title Pattern" ParameterName="AssemblyTitlePattern" /> <mtbw:ProcessParameterMetadata Category="Build Versioning (Optional)" Description="Assembly Description Attribute: String value specifying a short description that summarizes the nature and purpose of the assembly." DisplayName="Assembly Description Pattern" ParameterName="AssemblyDescriptionPattern" /> <mtbw:ProcessParameterMetadata Category="Build Versioning (Optional)" Description="Assembly Configuration Attribute: String value indicating the configuration of the assembly, such as Retail or Debug. The runtime does not use this value." DisplayName="Assembly Configuration Pattern" ParameterName="AssemblyConfigurationPattern" /> <mtbw:ProcessParameterMetadata Category="Build Versioning (Optional)" Description="Assembly Company Attribute: String value specifying a company name." DisplayName="Assembly Company Pattern" ParameterName="AssemblyCompanyPattern" /> <mtbw:ProcessParameterMetadata Category="Build Versioning (Optional)" Description="Assembly Product Attribute: String value specifying product information." DisplayName="Assembly Product Pattern" ParameterName="AssemblyProductPattern" /> <mtbw:ProcessParameterMetadata Category="Build Versioning (Optional)" Description="Assembly Copyright Attribute: String value specifying copyright information." DisplayName="Assembly Copyright Pattern" ParameterName="AssemblyCopyrightPattern" /> <mtbw:ProcessParameterMetadata Category="Build Versioning (Optional)" Description="Assembly Trademark Attribute: String value specifying trademark information.
" DisplayName="Assembly Trademark Pattern" ParameterName="AssemblyTrademarkPattern" /> <mtbw:ProcessParameterMetadata Category="Build Versioning (Optional)" Description="Assembly Culture Attribute: Enumerated field indicating the culture that the assembly supports. An assembly can also specify culture independence, indicating that it contains the resources for the default culture." DisplayName="Assembly Culture Pattern" ParameterName="AssemblyCulturePattern" /> <mtbw:ProcessParameterMetadata Category="Build Versioning (Optional)" Description="Assembly Informational Version Attribute: String value specifying version information that is not used by the common language runtime, such as a full product version number. " DisplayName="Assembly Informational Version Pattern" ParameterName="AssemblyInformationalVersionPattern" /> |
- Back in the XAML editor navigate to the Arguments editor and supply default values for some arguments as follows:
- AssemblyFileVersionPattern = "1.0.J.B"
- AssemblyInfoFilePattern = "AssemblyInfo.*"
- AssemblyVersionPattern = "1.0.0.0"
- BuildNumberPrefix = 0
- DoCheckinAssemblyInfoFiles = False
- ForceCreateVersion = False
- UseVersionSeedFile = False
- VersionSeedFilePath= "TfsVersion\VersionSeed.xml"
- Navigate to the Variables editor and create the following variables (you may need to Browse for Types to get some of the variable types):
- Name = BuildAgent; Variable Type = Microsoft.TeamFoundation.Build.Client.iBuildAgent; Scope = Compile, Test and Publish
- Name = BuildDetail; Variable Type = Microsoft.TeamFoundation.Build.Client.iBuildDetail; Scope = Compile, Test and Publish
- Name = BuildDirectory; Variable Type = String; Scope = Compile, Test and Publish
- Name = Workspace, Variable Type = Microsoft.TeamFoundation.VersionControl.Client.Workspace; Scope = Compile, Test and Publish
- From Toolbox > Team Foundation Build Activities add the following activities to the top of Compile, Test and Publish so they appear in the order listed:
- Activity = GetBuildAgent; Result = BuildAgent
- Activity = GetBuildDetail; Result = BuildDetail
- Activity = GetWorkspace; Name = String.Format("{0}_{1}_{2}", BuildDetail.BuildDefinition.Id, Microsoft.TeamFoundation.LinkingUtilities.DecodeUri(BuildAgent.Uri.AbsoluteUri).ToolSpecificId, BuildAgent.ServiceHost.Name); Result = Workspace
- Return to the properties of the VersionAssemblyInfoFiles activity and use the ellipsis at the end of each row to replace Enter a VB expression with the correct value. The result should be as follows:

- As a final step in this section save all the changes and check them in to version control.
Testing the Updated ReleaseTfvcTemplate.12 Release Template
At long last we are in a position to test the new template. The easiest way is to edit the test build definition created above and replace VersioningBuildTemplate20.xaml with our updated ReleaseTfvcTemplate.12.xaml version. Set any properties as required and queue a new build. With luck you will have a successful build and a set of uniformly versioned assemblies!
If you are having difficulty in implementing the steps above the debugging process is reasonably straightforward. Once the build template has been added to the test build definition you can make changes to the template, save them and then check them in to version control. Simply queue a new build to check your changes.
The final piece of the jigsaw when everything is working is to edit ContosoUniversity_Main_Nightly to use the new version of the template. And to enjoy a well-deserved drink.
Cheers -- Graham
Continuous Delivery with TFS: Save to a Folder for Stages You Can’t Yet Deploy to
In previous posts in this blog series on continuous delivery with TFS our activities have been geared up to deploying the sample application to target servers -- or nodes as they are sometimes referred to. But what happens when for some reason you have an environment that's just not ready to be a target for automated deployment? Maybe the business is just not ready to go that far right now. Maybe there is some technical hurdle you have yet to overcome. On the other hand you have already experienced how easy it is to manage the configuration of your application with Release Management and how it can bring config order where once there was chaos.
If you find yourself in this position a possible interim solution is to use Release Management to create what I call Release Ready Builds™ of your application. These are builds which have the correct configuration for the environment they are destined for but which are saved to a staging disk location rather than being actually deployed to target servers. Deployment of these builds is still likely to be a manual process but that's probably what you are doing already and at least the configuration and any other jiggery-pokery can be taken care of by Release Management.
Create a New Stage
In order to illustrate this technique I'm going to add a new stage to the deployment pipeline called PRD. This will represent the production environment that for whatever reason I'm unable to deploy to using Release Management automation. Carry out the following in Release Management:
- Add a stage type called PRD from Administration > Manage Pick Lists > Stage Type.
- Create a new Agent-based environment called Contoso University\PRD from Configure Paths > Environments. I linked my web server (ALMWEB01) for convenience but in a non demo context you would probably want to use something more permanent such as a build server. This would of course entail installing the Deployment Agent on that server.
- Add the new environment to the Contoso University\DAT>DQA release path from Configure Paths > Agent-based Release paths. The stage should be fully automated with email notifications turned off and this is probably a good time to change the name of the release path to Contoso University\DAT>DQA>PRD.

- Whilst in the newly renamed Contoso University\DAT>DQA>PRD release path help to speed up the debugging process by making the DQA stage fully automated, removing any Approvers from the Approval Step and turning off email notifications.
- Open the Contoso University\DAT>DQA release template from Configure Apps > Agent-based Release Templates and in Properties change the name to Contoso University\DAT>DQA>PRD.
- On the web server (ALMWEB01 in my case) create a folder called C:\ReleaseReadyBuilds.
Configure New Components
With the PRD stage added we now need to create new components that will deploy to a folder structure. For the web application it's not really all that different because we're using XCopy anyway as the deployment method so it's just a case of specifying a new location. The database side of things is more interesting because we need to create scripts rather than run actions against a database. On top of all this we need a mechanism to ensure that each release is placed in a unique folder. To achieve this carry out the following steps in Release Management Configure Apps > Components:
- Create a new component called Contoso University\Script DACPAC and configure as follows:
- Source > Builds with application (= selected) > Path to package = \
- Deployment:
- Tool = DACPAC Database Deployer
- Arguments = /Action:Script /SourceFile:"__FileName__" /TargetServerName:"__ServerName__" /TargetDatabaseName:"__DatabaseName__" /OutputPath:"__OutputPath__"
- Parameters > OutputPath > Description = The location for the DACPAC script file
- Create a new component called Contoso University\Script Login & User SQL Script and configure as follows:
- Source > Builds with application (= selected) > Path to package = \Scripts
- Deployment:
- Tool = Windows Common IO
- Arguments = -File ./ManageWindowsIO.ps1 -Action __Action__ -FileFolderName "__FileFolderName__" -DestinationName "__DestinationName__"
- Parameters > DestinationName > Description = Location to copy the file to
- Configuration Variables:
- Variable Replacement Mode = Before Installation
- File Extension Filter = *.sql
- Parameter #1 = LOGIN_OR_USER | Standard | Name of login or user to create
- Parameter #2 = DB_NAME | Standard | Database to set security for
- Create a new component called Contoso University\RRB and configure as follows:
- Source > Builds with application (= selected) > Path to package = \
- Deployment:
- Tool = Windows Common IO
- Arguments = -File ./ManageWindowsIO.ps1 -Action __Action__ -FileFolderName "__FileFolderName__" -DestinationName "__DestinationName__"
- Parameters > DestinationName > Description = Destination name
Configure the PRD Stage
Next we need to configure the PRD stage. To achieve this carry out the following steps in the Contoso University\DAT>DQA>PRD agent-based release template:
- In order to speed up the debugging process visit the DAT and DQA stages and click the top left hand icon of every action or component to toggle the skip state:

- In the PRD stage drag the ALMWEB01 server to the Deployment Sequence.
- Drag the Contoso University\Deploy Web Site to ALMWEB01 and set the parameters as follows:
- Installation Path = C:\ReleaseReadyBuilds\PRD\Web
- DATA_SOURCE = ALMSQL01
- INITIAL_CATALOG = CU-PRD
- Navigate to Toolbox > Windows OS and drag a Create Folder action below Contoso University\Deploy Web Site and set the FolderName to C:\ReleaseReadyBuilds\PRD\Database.
- Navigate to Toolbox > Components and right-click the Components node. Add Contoso University\Script DACPAC.
- Drag the Contoso University\Script DACPAC component below the Create Folder action and set the parameters as follows:
- FileName = ContosoUniversity.Database.dacpac
- ServerName = ALMSQL01
- DatabaseName = CU-PRD
- OutputPath = C:\ReleaseReadyBuilds\PRD\Database\DACPAC.sql
- Navigate to Toolbox > Components and right-click the Components node. Add Contoso University\Script Login & User SQL Script.
- Drag the Contoso University\Script Login & User SQL Script component below the Contoso University\Script DACPAC component and set the parameters as follows:
- Action = move
- FileFolderName = Create login and database user.sql
- DestinationName = C:\ReleaseReadyBuilds\PRD\Database\Create login and database user.sql
- LOGIN_OR_USER = ALM\CU-PRD
- DB_NAME = CU-PRD
- Navigate to Toolbox > Components and right-click the Components node. Add Contoso University\RRB.
- Drag the Contoso University\RRB component below the Contoso University\Script Login & User SQL Script component and set the parameters as follows:
- Action = create
- FileFolderName = C:\ReleaseReadyBuilds\$(BuildNumber)
- Drag a second Contoso University\RRB component below the first one and set the parameters as follows:
- Action = move
- FileFolderName = C:\ReleaseReadyBuilds\PRD
- DestinationName = C:\ReleaseReadyBuilds\$(BuildNumber)\PRD
Check the Stage Works
Navigate to Releases > Releases and manually create a release based on the latest build. Because the previous stages are in skip mode the PRD stage should finish almost immediately and you should very quickly be able to verify everything is working. Essentially you should be checking for a folder similar to C:\ReleaseReadyBuilds\ContosoUniversity_Main_Nightly_20150214.8 that contains a PRD folder with Web and Database folders containing our deployable artefacts. The magic that achieves this is the $(BuildNumber) configuration variable that is one of several that are only available in components. If that's all working then you should revisit the DAT and DQA stages and toggle all the component and actions so that they are not skipped, but leave DQA in automated mode. Now run a couple of complete builds from the nightly build definition in Visual Studio, confirming that each PRD build is placed in its own separate folder. Finally, when that's working you can revisit the DQA stage and return it to its manual status.
By way of finishing off I want to stress that you should be doing everything possible to use the full automation capabilities of Release Management to deploy your application along the whole delivery pipeline. But when you really do have a problem with a particular stage hopefully the technique I've illustrated here will tide you over.
Cheers -- Graham
Continuous Delivery with TFS: Promoting a Release to the DQA Stage
In a previous post in this series on implementing continuous delivery with TFS we arrived at the point of being able to run automated web tests on a build of the application deployed to the DAT environment. Any build that passes this stage is a candidate to be promoted to the next stage in the pipeline, and in my demo environment this is DQA (development quality assurance). The scenario I had in mind when building the demo environment was that it would be used by a Scrum team delivering features from a backlog of Product Backlog Items. Part of this development effort would include some manual testing, either of features that are impossible or impractical to test automatically ("text is a certain colour" for example), or for features where the effort of writing an automated test wouldn't make sense. In my demo environment the DQA stage is where this manual testing activity would take place.
Typically, not every build that passes the DAT stage will be promoted to the DQA stage as there may be insufficient change to warrant manual inspection. Additionally, if someone is in the middle of running some manual tests in DQA they probably don't want to find that the build they are testing has suddenly been replaced by a new one. Consequently the deployment of builds that do need to be promoted to DQA will need to be triggered manually. This leads on to questions such as who should trigger a deployment to DQA, how can they decide which build to promote if there are choices to be made and which tools should be used? (Note that I'm assuming here that any build that passes the DAT stage is a candidate for promotion to DQA. It's perfectly possible though to build in an approval step at the end of the DAT stage to require someone to explicitly indicate that a build can be promoted to DQA.)
Revisiting the Release Management Approvals Workflow
In order to understand the options that are available for answering the questions I have just posed a good starting point is to revisit the Release Management approvals workflow for the DQA stage by opening Release Management and navigating to Configure Paths > Agent-based Release Paths and opening the Contoso University\DAT>DQA release path. In a previous post we configured the DQA stage so that each stage is manual and all activity is governed by members of the Quality Assurance security group:

I am well aware that The Scrum Guide "recognizes no titles for Development Team members other than Developer" and I'm not going to go in to the ins and outs of which team members should be allowed to govern the deployment of releases. Suffice it to say though that Release Management provides plenty of options for whatever scenario you are working with, and each step can be either a named individual or a security group consisting of one of more individuals.
Looking at the DQA stage image in closer detail there are some subtle details (highlighted in red) that are worth mentioning. Firstly, it's possible to toggle email notifications for each step by clicking the email icon, which changes to a brighter image when notifications are turned on. Secondly, it's possible to have multiple Approvers for the Approval Step. Note that this means that all Approvers need to approve before the build can become a candidate for the next stage. (A further stage hasn't been defined in my demo environment so the Approval Step concept doesn't make complete sense here, but you get the idea.)
Managing the Governance of the Release Process
Having looked at the options for setting up who should be allowed to govern the release to DQA process we can now turn to the actual process of managing it. Although the Release Management client allows for the management of the approvals process (Releases > My Approval Requests) there is another tool called Release Explorer (actually a web page) which is dedicated to this purpose. This simplifies things somewhat since you don't need to install the client on lots of PCs and you don't need to have lots of users needing to get to grips with the client user interface. The Release Explorer URL will be something like http://almtfsadmin:1000/ReleaseManagement -- obviously if your server name is different then so will the URL be. The first time you open Release Explorer can be a bit of a shock -- it's ugly and of limited functionality to say the least. The Release Management User Guide has instructions on how to use what functionality is present.
With DQA configured as above and with all email notifications turned on triggering a build of ContosoUniversity_Main_Nightly will result in the following process once the DAT stage is complete:
- Anyone in the Acceptance Step > Approver role receives an Deployment Acceptance Required! email.
- Release Explorer lists the release as waiting for Acceptance. If you have multiple releases listed and you have a reasonably descriptive release template name chances are that you'll need to hover over the release name to show the date and time as a popup (highlighted in red below):

- Still in Release Explorer the release can be selected and clicking the Approve button displays a dialog for confirming the actual deployment to DQA with the ability to add a comment.
- At the start of the deployment anyone in the Deployment Step > Owner role receives a Deployment in Progress email.
- At the end of the deployment anyone in the Validation Step > Validator role receives a Deployment Validation Required! email.
- Release Explorer lists the release as waiting for Validation. A person in the Validator role would presumably navigate to the application and make sure it is working as expected or in a more sophisticated setup start a series of automated validation smoke tests.
- Still in Release Explorer the release can be selected and clicking the Approve button displays a dialog for confirming the successful deployment to DQA with the ability to add a comment.
- Anyone in the Approval Step > Approver role receives a Deployment Approval Required! email.
- Release Explorer lists the release as waiting for Approval. All the people in the Approver role now need to assure themselves by whatever means that, in the words of the email, the "deployed application meets the minimum quality requirements needed to complete this stage".
- Still in Release Explorer the release can be selected and clicking the Approve button displays a dialog for confirming the successful release to DQA with the ability to add a comment.
- In Release Management under Releases > Releases the release now has the status Released.
The full process can involve a lot of emails and a lot of individual steps. It might be overkill for every stage of your deployment but it's good to know that there is a comprehensive set of options should you need them.
Which Release to Promote to DQA?
Unfortunately the workflow around determining which release to actually promote to DQA is somewhat clunky and I can only hope that this will be improved in a future version of Release Management. Of course if you just want the latest and greatest then it's easy to work that out from Release Explorer as it will be the first release in the list. Another scenario though is where the development team are coding features against PBI Task work items and fixing bugs against Bug work items and checking code in against those work items as appropriate. In this case someone who is responsible for manual testing may want to choose a specific release that contains certain features or fixed bugs. Each build report has a list of Associated work items and either Visual Studio or Team Web Access can be used to inspect build reports but unfortunately there is nothing in Release Explorer. Of course each build report only lists what has been associated since the last build so there may be some effort required to find the build that contains all the desired work items.
Regrettably once the desired build has been identified in Visual Studio or Team Web Access there doesn't appear to be an exact way to match it with a release listed in Release Explorer since Release Explorer identifies a release by date and time and the build report uses date and build number for that day. Of course if only one release can become a candidate for promotion each day (because you run DAT overnight for example) then disambiguation will be easy but in a more fast-paced environment that may not be the case.
That completes our examination of the workflow for promoting a release to the DQA environment. If you have any ideas for fine tuning it do let me know via the comments.
Cheers -- Graham


